The Story
Scaling New Heights
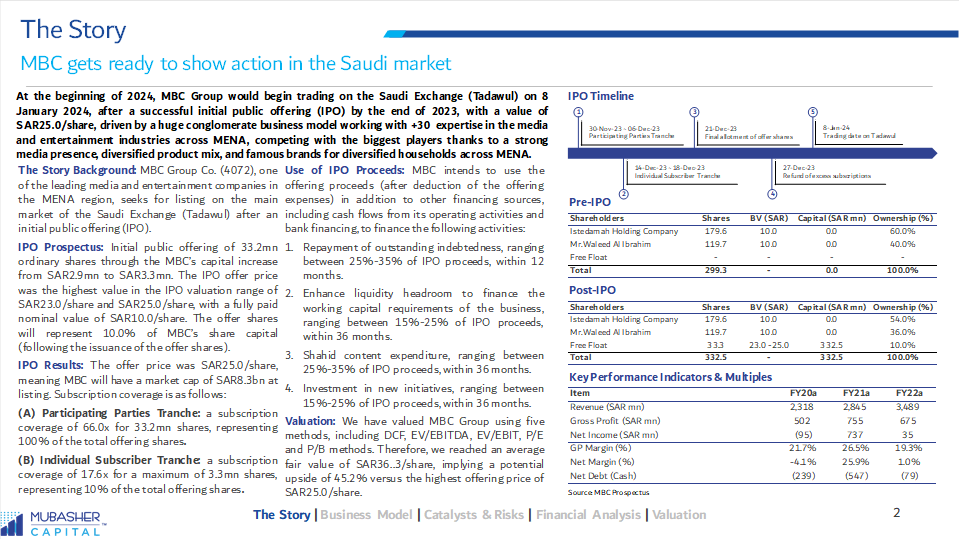
ADNOC Logistics & Services (ADNOC L&S) is a leading provider of maritime logistics and services for the ADNOC Group, with a global footprint serving over 100 customers in more than 50 countries. It boasts the largest and most diversified shipping fleet in the Middle East and operates one of the region’s largest integrated energy supply bases. We valued the share using Discounted Cash Flow (DCF) and multiple valuation approaches, arriving at a fair value (FV) of EGP11.8/share (+117% Pot.).
ADNOC Logistics & Services (ADNOC L&S), a subsidiary of the ADNOC Group, specializes in providing comprehensive logistics, shipping, and offshore services within the UAE and internationally. In 2023, ADNOC got listed in ADX and the offering received an overwhelming response, with shares being oversubscribed 163 times. As a fully integrated leader in global energy maritime logistics, ADNOC L&S supports the energy supply chain with essential services. By the end of 2023, the company operated a fleet of 233 vessels and managed an additional 600 chartered ships annually, serving over 100 customers in more than 50 countries.
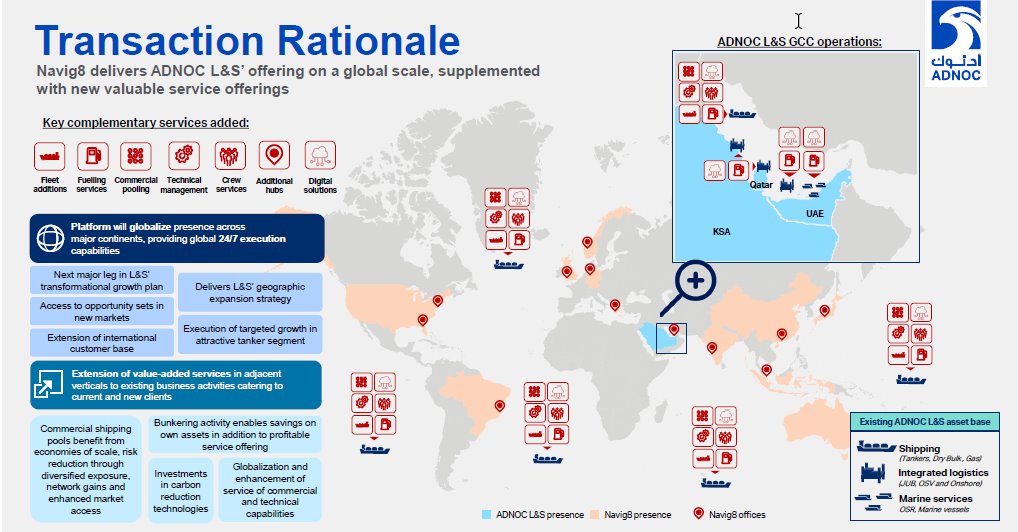
Amazing growth story ahead: In June 2024, ADNOC L&S announced a deal to acquire Navig8, an international shipping pool operator and commercial management company with a fleet of 32 modern tankers and operations in 15 cities across five continents. According to the agreement, ADNOC L&S will purchase 80% of Navig8 for USD1.04bn (AED3.8bn), with economic ownership starting from January 1, 2024. The remaining 20% will be acquired in 2027. This acquisition is expected to create significant value through cost optimization and synergies, aiming to achieve over USD100mn in savings throughout the project’s duration.
Our avg. FV stands at AED 11.8/share: In addition to discounted cash flow (DCF) model that yielded a FV of AED21 per share, we used relative valuation, utilizing the average P/E and EV/EBITDA multiples for FY24 pertaining to Logistics companies in the world. Assigning equal weights to both valuation methodologies resulted in an average fair value of AED11.8 per share, signifying a 117% upside potential.
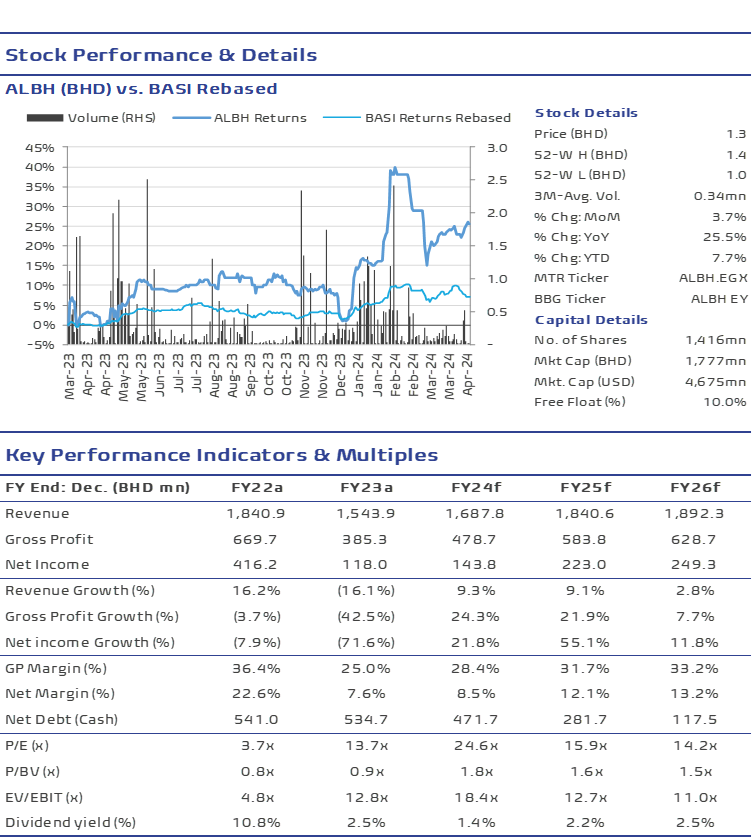
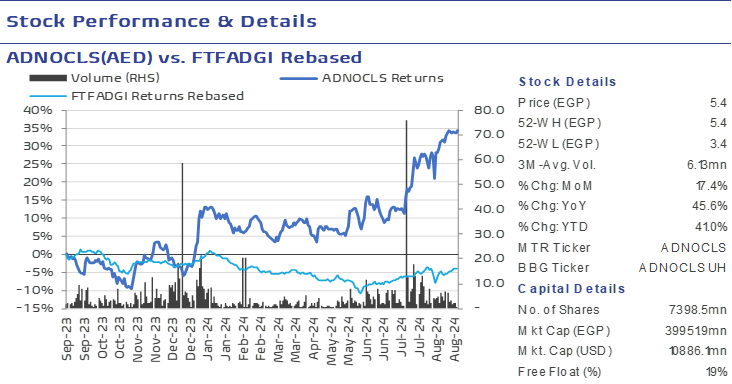
Stocks Details
KPI’s Summary
| FY End: Dec (USDmn) | FY21a | FY22a | FY23a |
| Revenue | 1,191 | 1,952 | 2,755 |
| Gross profit | 329 | 557 | 990 |
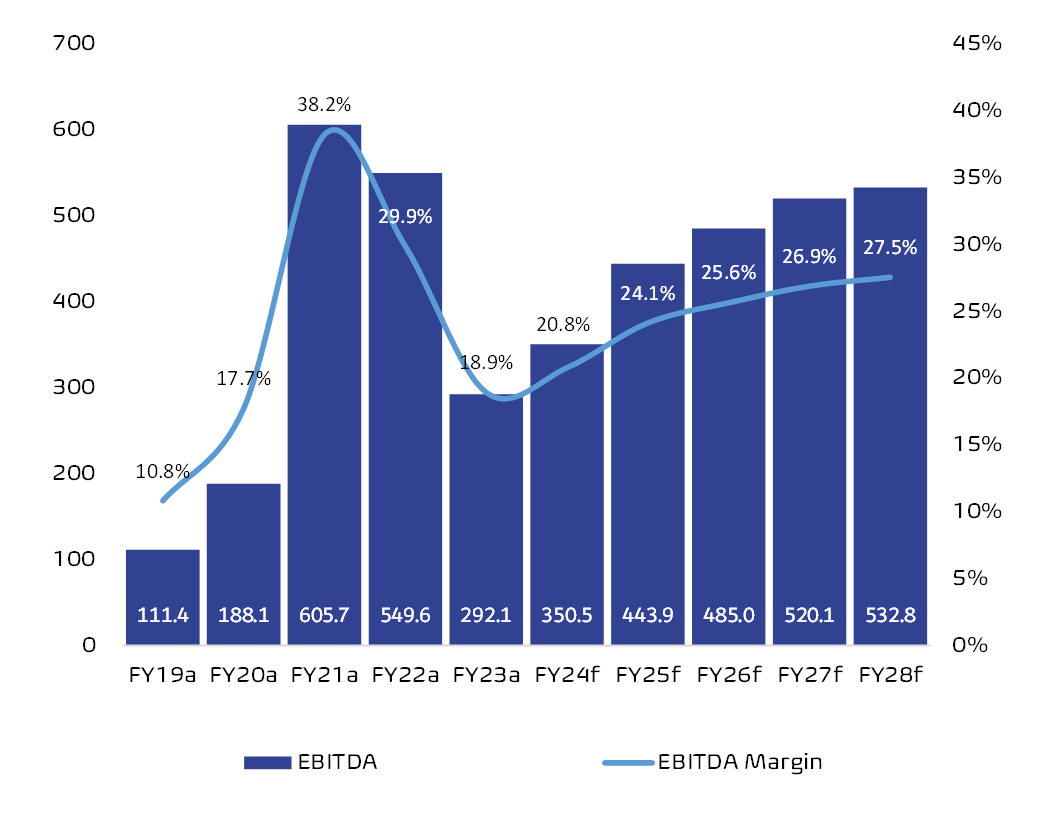
| EBITDA | 168 | 453 | 876 |
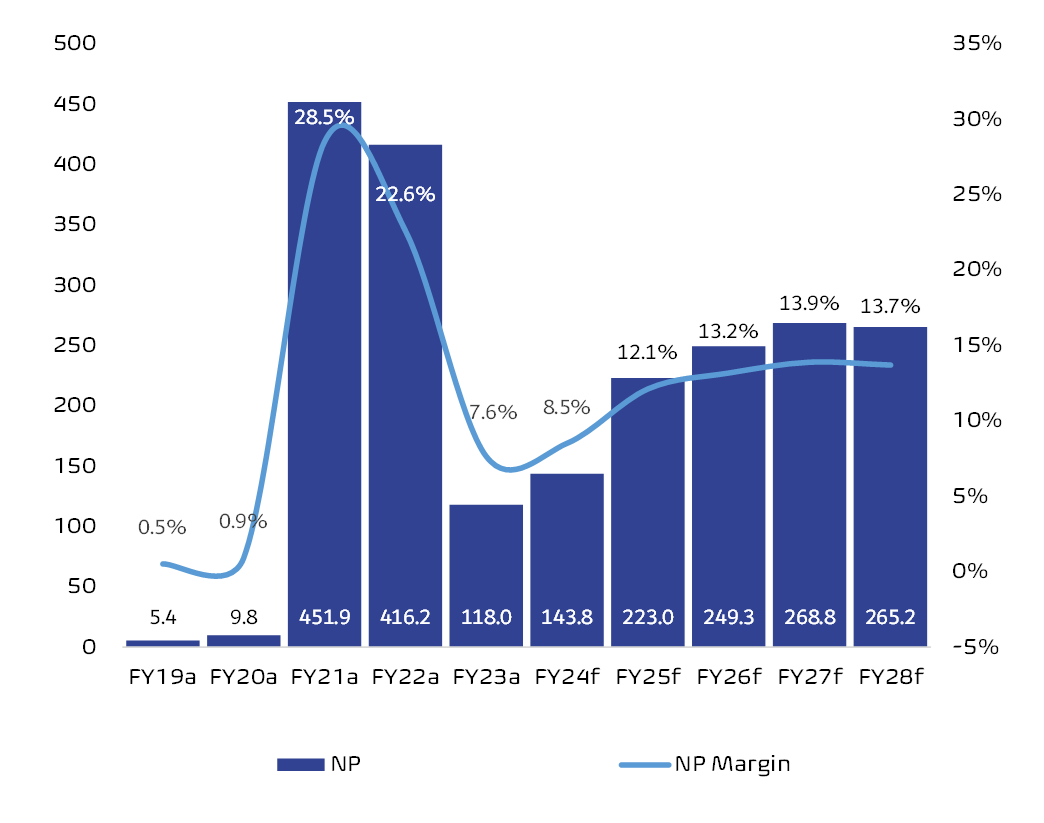
| Net Income | 55 | 261 | 620 |
| Revenue Growth (%) | NA | 64% | 41% |
| GP Growth (%) | NA | 69% | 78% |
| EBITDA Growth (%) | NA | 169% | 93% |
| Net Income Growth (%) | NA | 376% | 138% |
| Gross Profit Margin (%) | 27.6% | 28.5% | 35.9% |
| EBITDA Margin (%) | 14.1% | 23.2% | 31.8% |
| Net Profit Margin (%) | 4.6% | 13.4% | 22.5% |
| Net Debt (Cash) | 642 | 1,804 | 30 |
| EPS (USD) | 0.05 | 0.26 | 0.08 |
| BVPS (USD) | 1.53 | 1.80 | 0.60 |
| PER (x) | NA | NA | 12.3x |
| PBV (x) | NA | NA | 1.7x |
| ROE (%) | 4% | 14% | 14% |
Company Profile
Premier Provider of Logistics Solutions in MENA
ADNOC Logistics & Services (ADNOC L&S), a subsidiary of the ADNOC Group, is a dedicated provider of logistics services for both the ADNOC Group and the UAE, while also catering to international customers with a variety of shipping and offshore services. The company plays a crucial role in delivering essential and specialized services across the energy supply chain. ADNOC L&S was formed in 2016 through the consolidation of several ADNOC entities involved in integrated logistics, shipping, and marine services. Its origins, however, date back to the establishment of the Abu Dhabi National Tanker Company in 1975.
ADNOC L&S is recognized as a fully integrated leader in global energy maritime logistics, operating within three core segments. By the end of 2023, the company owned a fleet of 233 vessels and charters an additional 600 ships each year. With this extensive fleet, ADNOC L&S serves more than 100 customers across over 50 countries worldwide.
Groundbreaking IPO Success
In 2023, ADNOC L&S became the sixth company from the ADNOC Group to go public on the ADX. It was the second-largest IPO in the Middle East and North Africa that year and the most sought-after globally at the time of listing. The IPO saw unprecedented demand, with the stock being oversubscribed 163 times, showcasing strong confidence from both local and international investors. Following this, ADNOC L&S achieved outstanding financial results, with net profit rising by 138% y/y and revenue increasing by 41% y/y, highlighting the effectiveness of its growth strategy.
By the end of 2023, the company’s share price had surged by 91%, far outperforming the ADX, which grew by only 2% during the same period. ADNOC L&S also stood out as one of the top-performing stocks worldwide, surpassing the performance of both the S&P 500 and the MSCI Emerging Markets indices.
Revenues Streams
Series Of Acquisitions
The acquisition of Zakher Marine International (ZMI) was a key component of ADNOC L&S strategic growth and value creation, underscoring the dedication to fostering development and boosting investment in the UAE. ADNOC L&S acquired a substantial fleet that includes 23 self-propelled, self-elevating jack-up barges and 38 offshore support vessels operating across the UAE, Saudi Arabia, Qatar, and China. Founded in Abu Dhabi in 1984, ZMI Holdings has grown to offer top-tier services within the global offshore energy sector.
This acquisition enhances the capabilities by adding a diversified fleet of advanced jack-up barges and offshore support vessels, as well as subsea services. ZMI Holdings brings with it long-term contracts with major national and international oil companies, as well as EPC operators. A significant synergies are anticipated from integrating ZMI Holdings into the Integrated Logistics business unit. We will discuss another mega acquisition transaction in page 6.
Business Model
Fully Integrated L&S Business
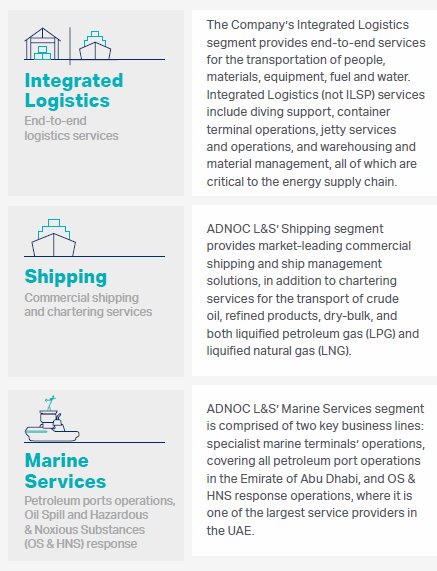
ADNOC L&S has 3 main segments which are Integrated logistics, Shipping and Marine Services will be discussed in details.
Integrated Logistics Business Unit: It combines services across three primary business lines: offshore logistics, onshore logistics, and jack-up barges. These services cater to the complex needs of the energy industry, from offshore oil and gas operations to onshore logistics and specialized vessel support.
1- Offshore Logistics Offshore Logistics is crucial to Integrated Logistics, providing essential services for offshore energy operations. It includes managing hubs, handling equipment, and transporting cargo and personnel. The segment operates a large fleet of 191 vessels, including tugs, supply vessels, and ferries, serving around 130,000 passengers annually.
2- Onshore Logistics provides a variety of logistics solutions, including warehousing and material management, packaging and container terminal operations as well as jetty services and operations through a number of bases such as:
- Borouge Container Terminal, Ruwais: Handles 760,000 TEUs and 3.5mn metric tones of cargo annually.
- KEZAD Gateway, Abu Dhabi: Features a large warehouse for polyolefins with a 180,000-tonne capacity and a 2.5mn-tonne throughput, supporting Borouge’s logistics. It connects to Khalifa Port and has room for expansion.
- Mussafah Logistics Base: One of the UAE’s largest energy supply bases, spanning 1.5mn sqm, with 14 berths and facilities for warehousing, material handling, and drilling chemicals. Manages around 4,500 port calls annually.
- Riash Logistics Base, Abu Dhabi: Includes warehousing and four vessel jetties, handling international cargo operations with ongoing expansions for additional capacity.
- Fujairah Base: Specializes in emergency response for oil spills, with a rapid response capability and support for an oil spill response vessel stationed at the Port of Fujairah.
3- Jack-Up Barges: ADNOC L&S manages a fleet of 23 owned and 8 operated jack-up barges, crucial for various oil and gas field operations. The barges are primarily used in the UAE and also in Saudi Arabia, Qatar, and China’s offshore wind sector. Key Services provided are: 1) Well services and maintenance, 2) Offshore worker accommodation, 3) Chartering to other companies, and 4) Subsea and EPC support.
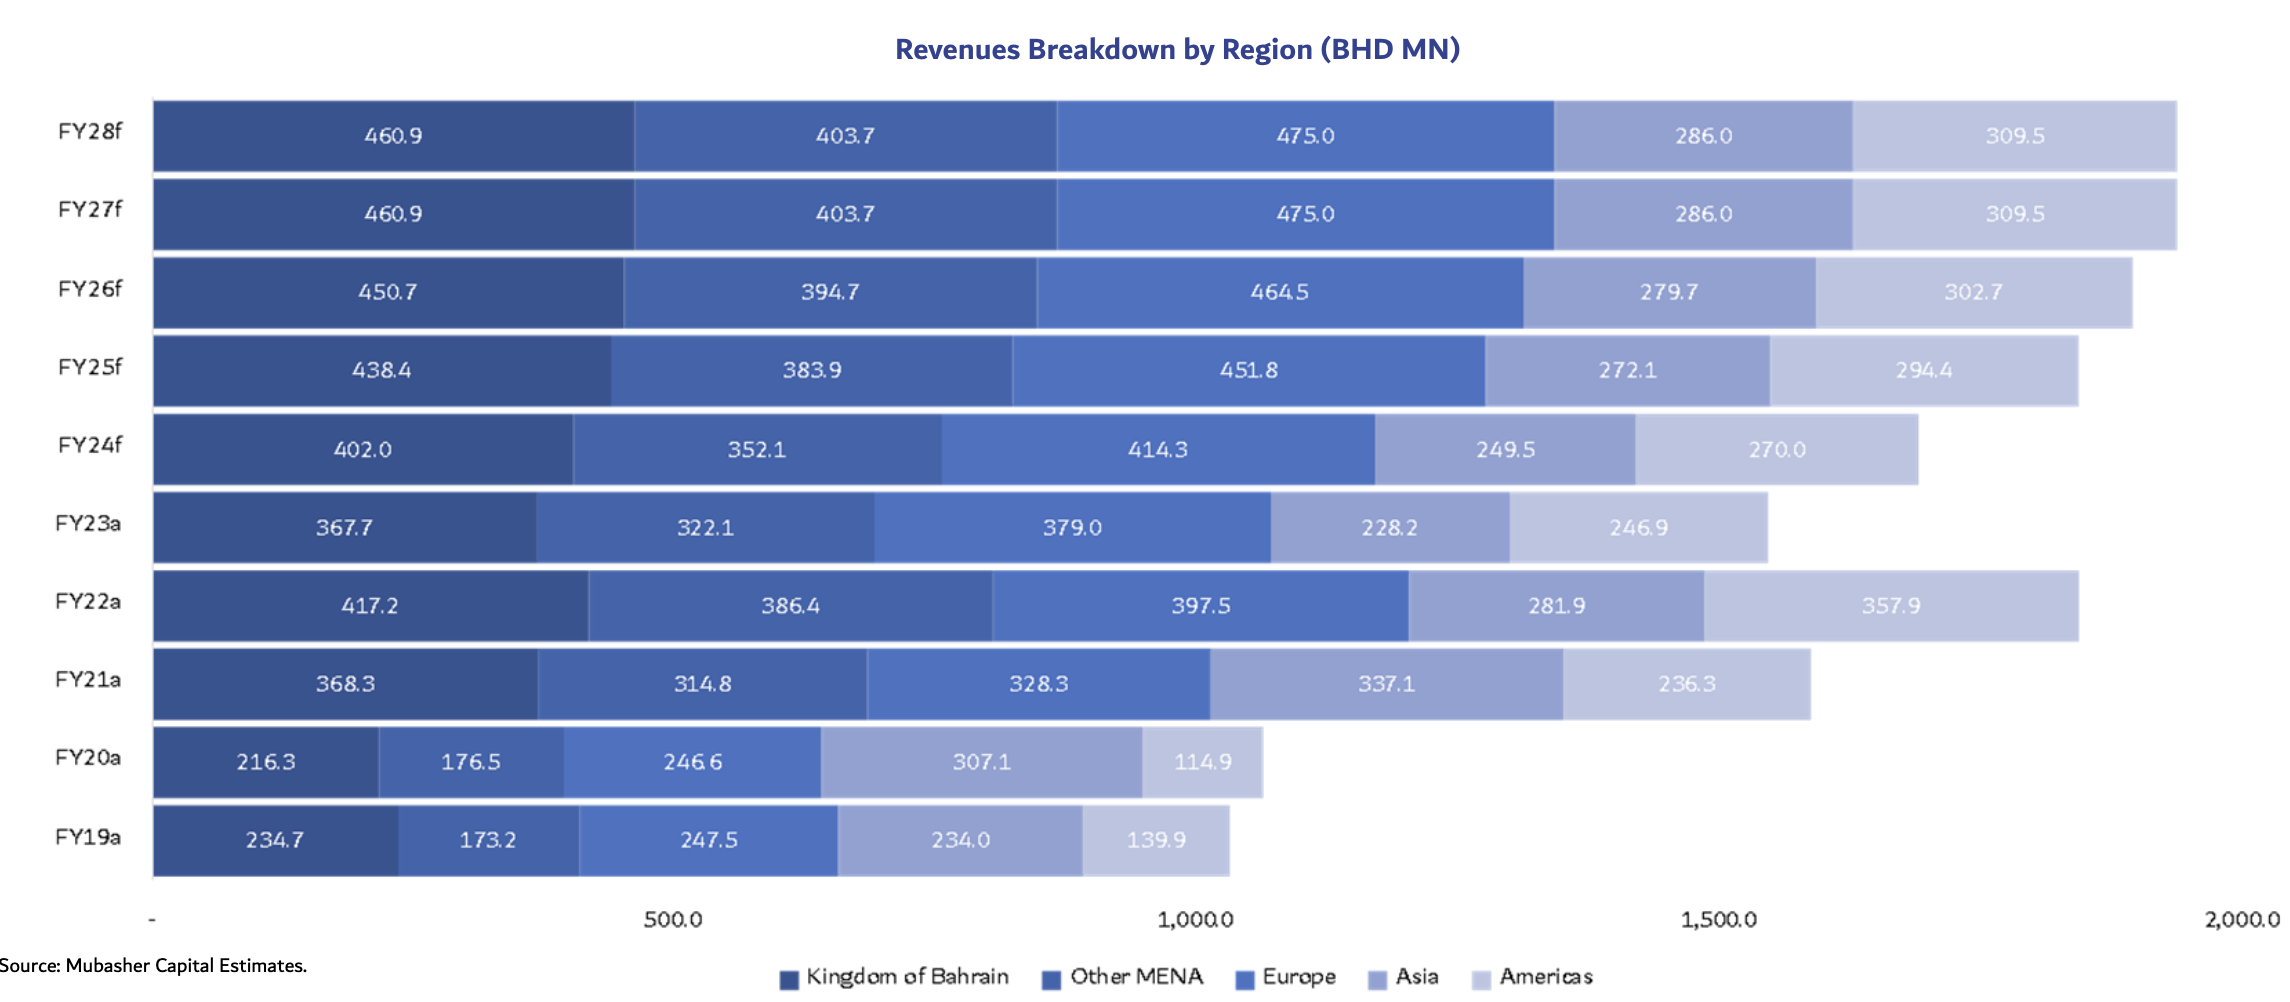
From its logistics bases and warehouses across the UAE, ADNOC L&S covers the entire offshore network
Reveunes Breakdown
| Revenues Breakdown | Unit | FY21 | FY22 | FY23 |
| Integrated Logistics | | | | |
| Revenues | USD mn | 428.6 | 923.0 | 1,739.0 |
| Growth | % | NA | 115% | 88% |
| As % of Total Revenue | % | 36% | 47% | 63% |
| EBITDA | USD mn | 103.3 | 164.0 | 532.4 |
| Growth | % | NA | 59% | 225% |
| Net Income | USD mn | 66.6 | 90.8 | 374.5 |
| Growth | % | NA | 36% | 312% |
| Shipping | | | | |
| Revenues | USD mn | 589.7 | 861.8 | 838.8 |
| Growth | % | NA | 46% | -3% |
| As % of Total Revenue | % | 50% | 44% | 30% |
| EBITDA | USD mn | 125.7 | 275.4 | 320.6 |
| Growth | % | NA | 119% | 16% |
| Net Income | USD mn | 67.6 | 204.2 | 239.9 |
| Growth | % | NA | 202% | 17% |
| Marine Services | | | | |
| Revenues | USD mn | 172.5 | 167.3 | 177.3 |
| Growth | % | NA | -3% | 6% |
| As % of Total Revenue | % | 14% | 9% | 6% |
| EBITDA | USD mn | 35.9 | 27.1 | 39.7 |
| Growth | % | NA | -25% | 47% |
| Net Income | USD mn | 21.9 | 10.3 | 19.8 |
| Growth | % | NA | -53% | 92% |
| Total | | | | |
| Revenues | USD mn | 1,190.8 | 1,952.2 | 2,755.2 |
| Growth | % | NA | 64% | 41% |
| EBITDA | USD mn | 168.3 | 453.3 | 876.3 |
| Growth | % | NA | 169% | 93% |
| Net Income | USD mn | 54.8 | 260.8 | 620.2 |
| Growth | % | NA | 376% | 138% |
Business Model (Cont’d)
Fully Integrated L&S Business
Shipping Business Unit: it handles different types of cargo through distinct segments, each focusing on specific goods and services, making it a versatile logistics provider in the maritime industry. This segment combines services across three primary business lines: Dry Bulk shipping, Tankers, and Gas Carriers.
- The dry bulk shipping segment operates nine owned vessels and several chartered-in vessels, offering flexibility to adapt to market conditions. This segment benefits from contracts covering all ADNOC Group’s Sulphur and petcock exports. Key Operations are :
- Sulphur Export: Transports all of ADNOC Gas’s Sulphur exports, totaling 4.2mn metric tones in 2022, with plans to increase to 6mn metric tones.
- Petcoke Transport: Handles 0.75mn metric tones of Petcoke exports in the UAE and occasionally transports green Petcoke globally.
- Container Transport: Manages domestic trade within the UAE, particularly containerized polypropylene for Borouge.
- Tankers: The tanker fleet includes VLCCs, LR1 and LR2 vessels, and chemical tankers, occasionally chartering additional vessels to leverage market opportunities.
Since 2020, ADNOC Logistics & Services has expanded its global presence, particularly in markets like the USA, West Africa, South America, and the far East, focusing on refined products east of the Suez Canal.
Operational Shift: Transitioning from a Free On Board (FOB) model to a Cost and Freight (CFR) model, enabling ADNOC to manage more of the supply chain.
Revenue Strategy: Combines long-term contracts for chemical tankers with spot market operations for other tankers, allowing flexibility and responsiveness to market conditions.
- Gas Carriers: ADNOC’s gas carriers business focuses on predictable revenue through long-term time charters for LNG and LPG carriers, ensuring stable income.
Expansion and Fleet Growth: Six new LNG carriers are set to be delivered between 2025 and 2026, with five already under long-term contracts, aligning with global LNG demand growth.
Investment Strategy: Extends the life of older LNG carriers (over 35 years) and invests in new vessels with advanced technologies to improve fuel efficiency and reduce emissions, enhancing sustainability and competitiveness.
Strategic Focus: Emphasizes profitability, cost discipline, and sustainability by upgrading the fleet and leveraging market trends to boost long-term growth.

Marine Services Unit has two main business lines: (1) marine terminal operations, which include managing all petroleum ports in the Emirate of Abu Dhabi, and (2) oil spill and hazardous substance response services, making it one of the largest responders in the UAE.
Oil Spill and Hazardous Substances Response: ADNOC L&S is a key responder for oil spills and hazardous substances in the UAE, equipped with advanced technology, specialized vessels, and a team of 140 personnel. Services cover Tier 1, 2, and 3 incidents, from basic to major responses. Most revenue comes from a 20-year contract with ADNOC Group for Tier 2 services and additional agreements with third parties like TAQA and NAWAH.
Marine Terminal Operations: ADNOC L&S oversees ADNOC Group’s export facilities, managing both onshore ports (Jebel Al Dhanna and Ruwais) and offshore ports (Das, Zirku, Mubarraz) in Abu Dhabi. It is the exclusive operator licensed to service all petroleum ports in Abu Dhabi, earning revenue from a 25-year licensing agreement with ADNOC Group, established in 2020, and other specific contracts.
The Merge
Navig8, A new Brick in the Building
Who is Navig8: Navig8, established in 2007, is a leading global provider of shipping management services, operating from 16 strategic hubs across four continents. As a fully integrated entity, Navig8 functions as an owner, operator, and active charterer, offering unparalleled access to comprehensive shipping data worldwide. The company’s extensive network and industry expertise enable it to deliver top-tier logistics solutions and insights to its clients, solidifying its reputation as a key player in the international maritime sector.
The scoop on the deal:
- An initial purchase of an 80% stake will be made for approximately USD1.04bn in cash.
- The remaining 20% stake will be acquired in June 2027, with a base cost of around USD0.34bn and a possible additional USD0.12 bn depending on financial performance from 2024 to 2026.
- The implied enterprise value stands at about USD2.0bn (for the entire company), translating to a 4.9x 2023 EV/EBITDA multiple.
- The deal is projected to enhance EPS by more than 20% in the first full year and achieve a low double-digit unlevered IRR.
- Financing for the acquisition will come from available free cash after accounting for dividends and debt capacity.
- The transaction is subject to standard regulatory approvals and is expected to be completed in late 2024 or early 2025.
Valuation
Expected Upside potential of 117%
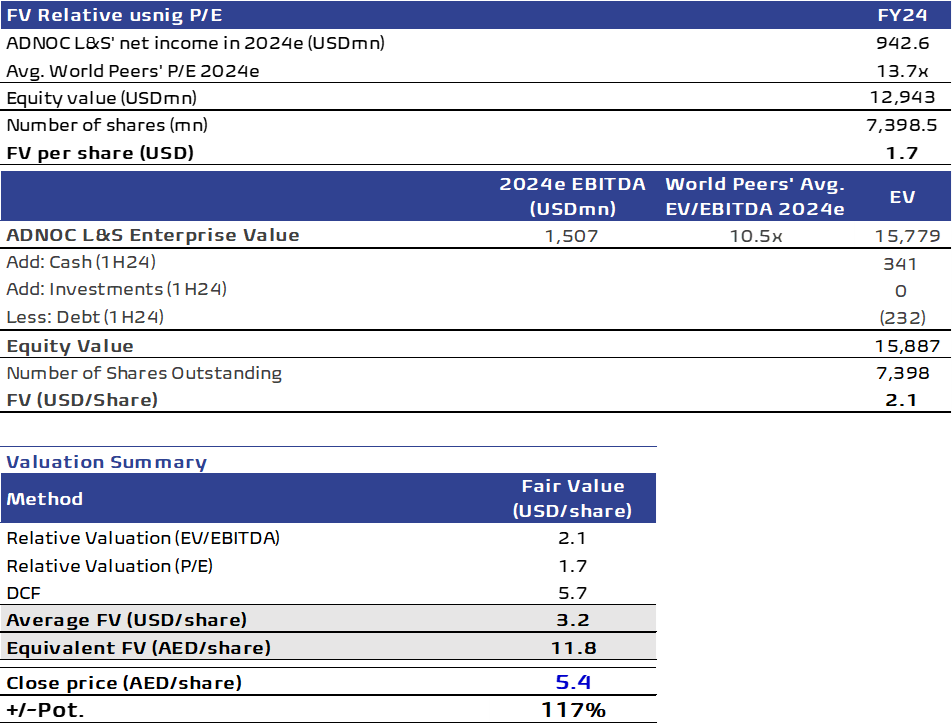
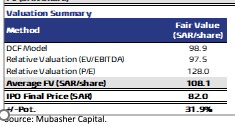
Our avg. FV stands at AED11.8/share: Alongside employing a discounted cash flow (DCF) model that yielded a FV of AED21 per share, as illustrated in the corresponding table, an alternative valuation approach was undertaken through a relative valuation. This involved utilizing the average P/E and EV/EBITDA multiples for FY24 pertaining to Logistics companies in the world.
The average P/E and EV/EBITDA multiples derived from world peers were applied to ADNOC L&S expected earnings and EBITDA for the FY24 to ascertain a fair value for the company’s stock. Assigning equal weights to both valuation methodologies resulted in an average fair value of AED11.8 per share, signifying a 117% upside potential.
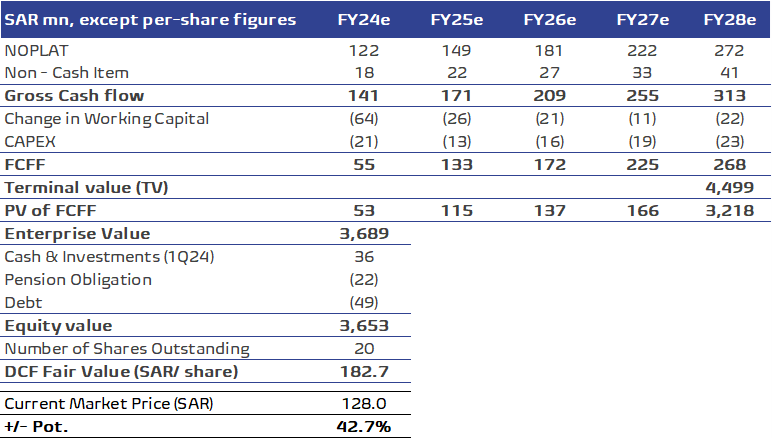
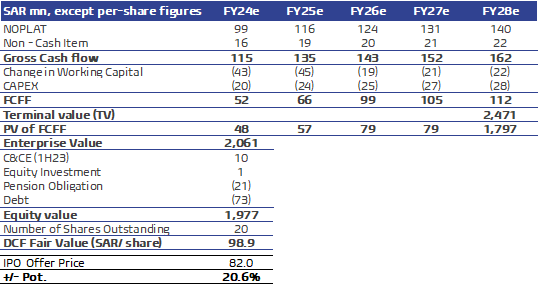
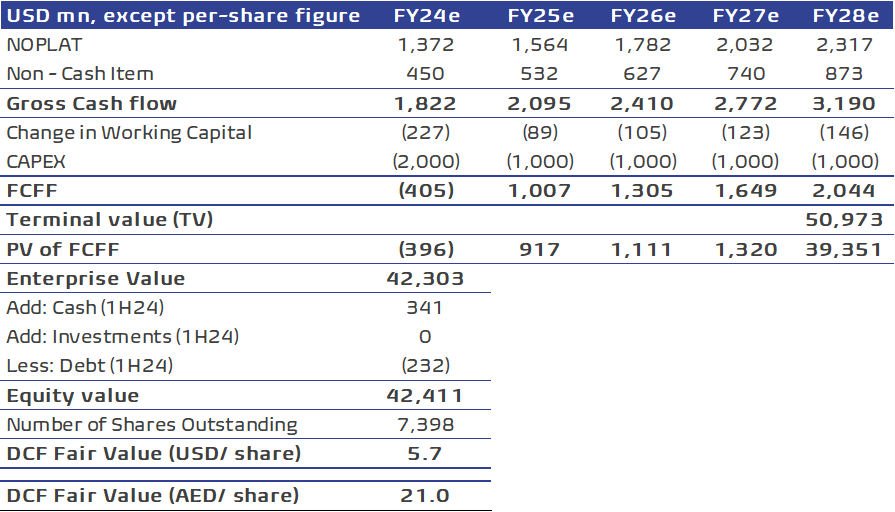
DCF – fair value AED 21/ share: We discounted ADNOC L&S’s free cash Flow to the firm (FCFF) over the coming five years (2024-2028) based on the following assumptions:
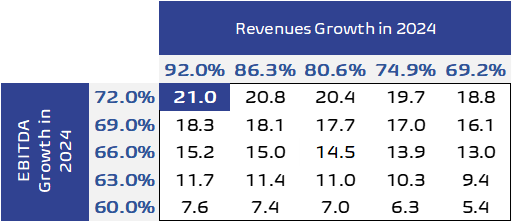
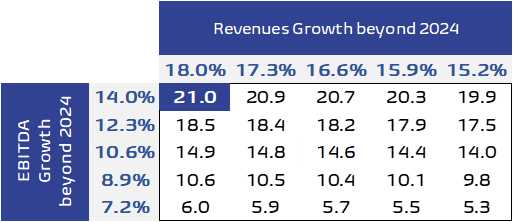
- Revenues to grow at a 3-Year CAGR of 18% to USD10.3bn between 2025 and 2028, following to 92% y/y growth in 2024 on the back of Navig8 merge, based on management announcement.
- EBITDA to grow at a 3-Year CAGR of 14% to USD2.5bn between 2025 and 2028, following to 72% y/y growth in 2024 on the back of Navig8 merge.
- CapEx to be USD2bn in 2024 for the Navig8 merge and other expansion plans then USD1bn for each forecasted year on the medium term from FY FY25 to FY28, according to the management.
- Working capital assumptions are based on historical averages cash conversion cycle (CCC).
- Cost of Equity (COE) is 7.2%, calculated as follows: UAE implied risk-free rate of 4.1% on average during forecasted period (based on US risk free rate and inflation differential between UAE vs. USA), UAE’s Equity Risk Premium (ERP) of 3.43% (based on a US market ERP of 5.48% and a relative standard deviation between US and UAE equity markets returns), and a Beta of 0.9.
- After tax cost of debt 5% on average.
- Capital structure of avg. 95% equity and 5% debt.
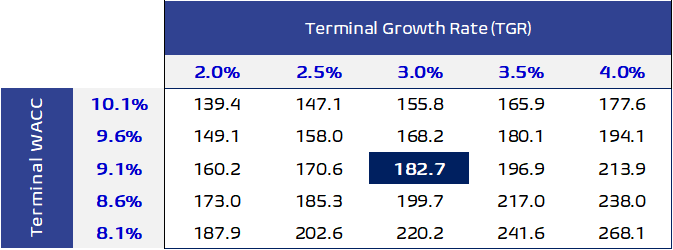
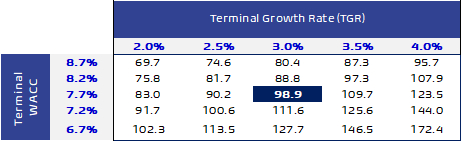
- Hence, we used a WACC of 7.1% on average during forecast horizon, with terminal year growth rate of 3%.
DFC Valuation
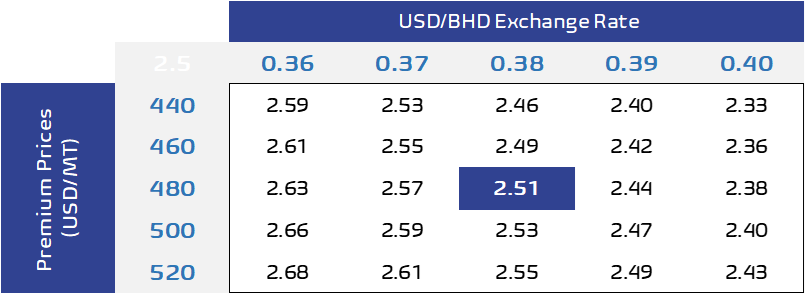
Sensitivity Analysis
Valuation (Cont’d)
Expected Upside potential of 117%
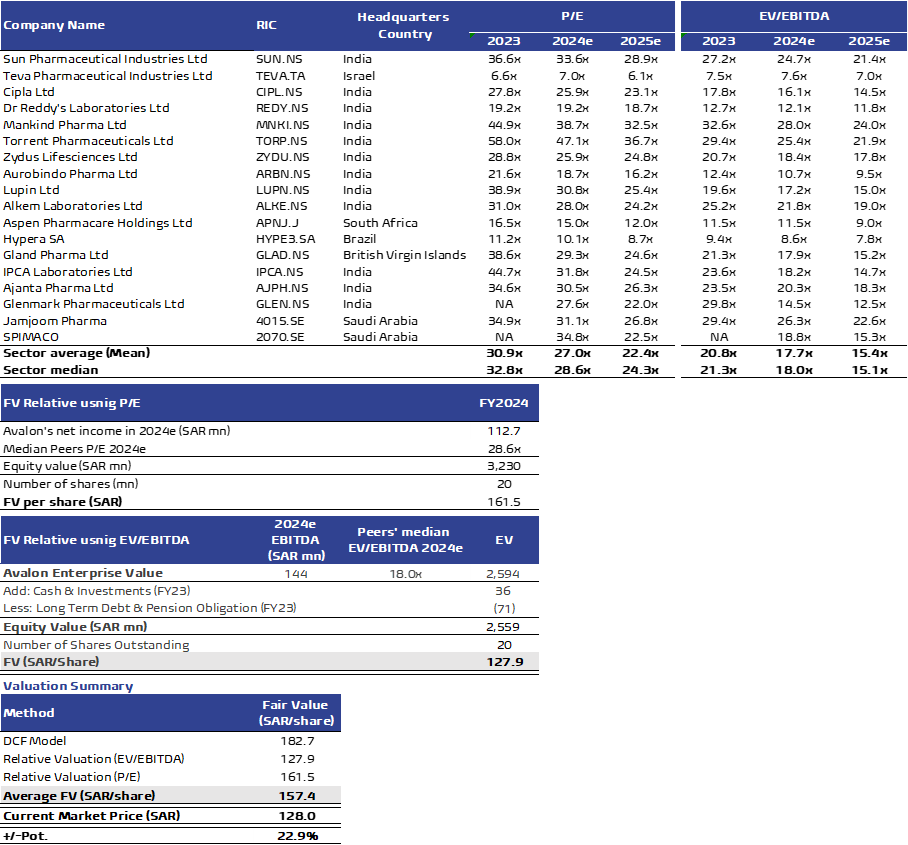
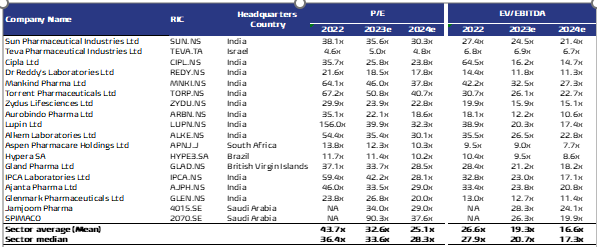
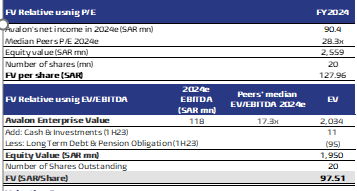
Multiples valuation: We used the world’s peers average P/E and EV/EBITDA FY24 multiples and applied them to ADNOC L&S’s expected earnings and EBITDA in FY24 to arrive at a fair value for the stock as follows:
- P/E: Using peers’ average FY24 P/E of 13.7x and our forecasted net income for FY24, we arrived at a fair value of USD1.7 or AED6.4/ share.
- EV/EBITDA: By applying peers’ average FY24 EV/EBITDA of 10.5x to our forecasted FY24 EBITDA, we arrived at a fair value of USD2.1 or AED7.8/ share.
- Our FV is AED 11.8/ share based on equal weights: We assign equal weights to both valuation techniques, reaching a fair value of AED 11.8/ share, which represents 117% upside potential.
Investment rationale:
- Leading provider of maritime logistics and services for the ADNOC Group.
- Global presence with over 100 customers in more than 50 countries.
- Largest and most diversified shipping fleet in the Middle East.
- Among the largest integrated energy supply bases in the region.
- Top-tier Integrated Logistics Services Platform (ILSP).
- Strong financial position, with steady cash flow and predictable earnings from long-term contracts.
- Expanding horizontally through series of acquisitions like ZMI and Navig8.
Key Risks:
- ADNOC L&S relies heavily on its relationships with ADNOC and its Group companies, which contribute a large share of its revenue.
- Growth could be limited without successful acquisitions or joint ventures, which are central to the business strategy.
- The company’s success is tied to Abu Dhabi’s energy sector growth plans.
- Business performance is dependent on renewing existing contracts and securing new ones, including charter agreements.
- Faces competition from both established players and new market entrants.
The fair values calculated using P/E and EV/EBITDA multiples were lower compared to those derived from DCF analysis, as these multiples do not adequately capture the significant growth expected in FY24 and beyond In our view.