The IPO story
A Promising Wheat Milling Maker
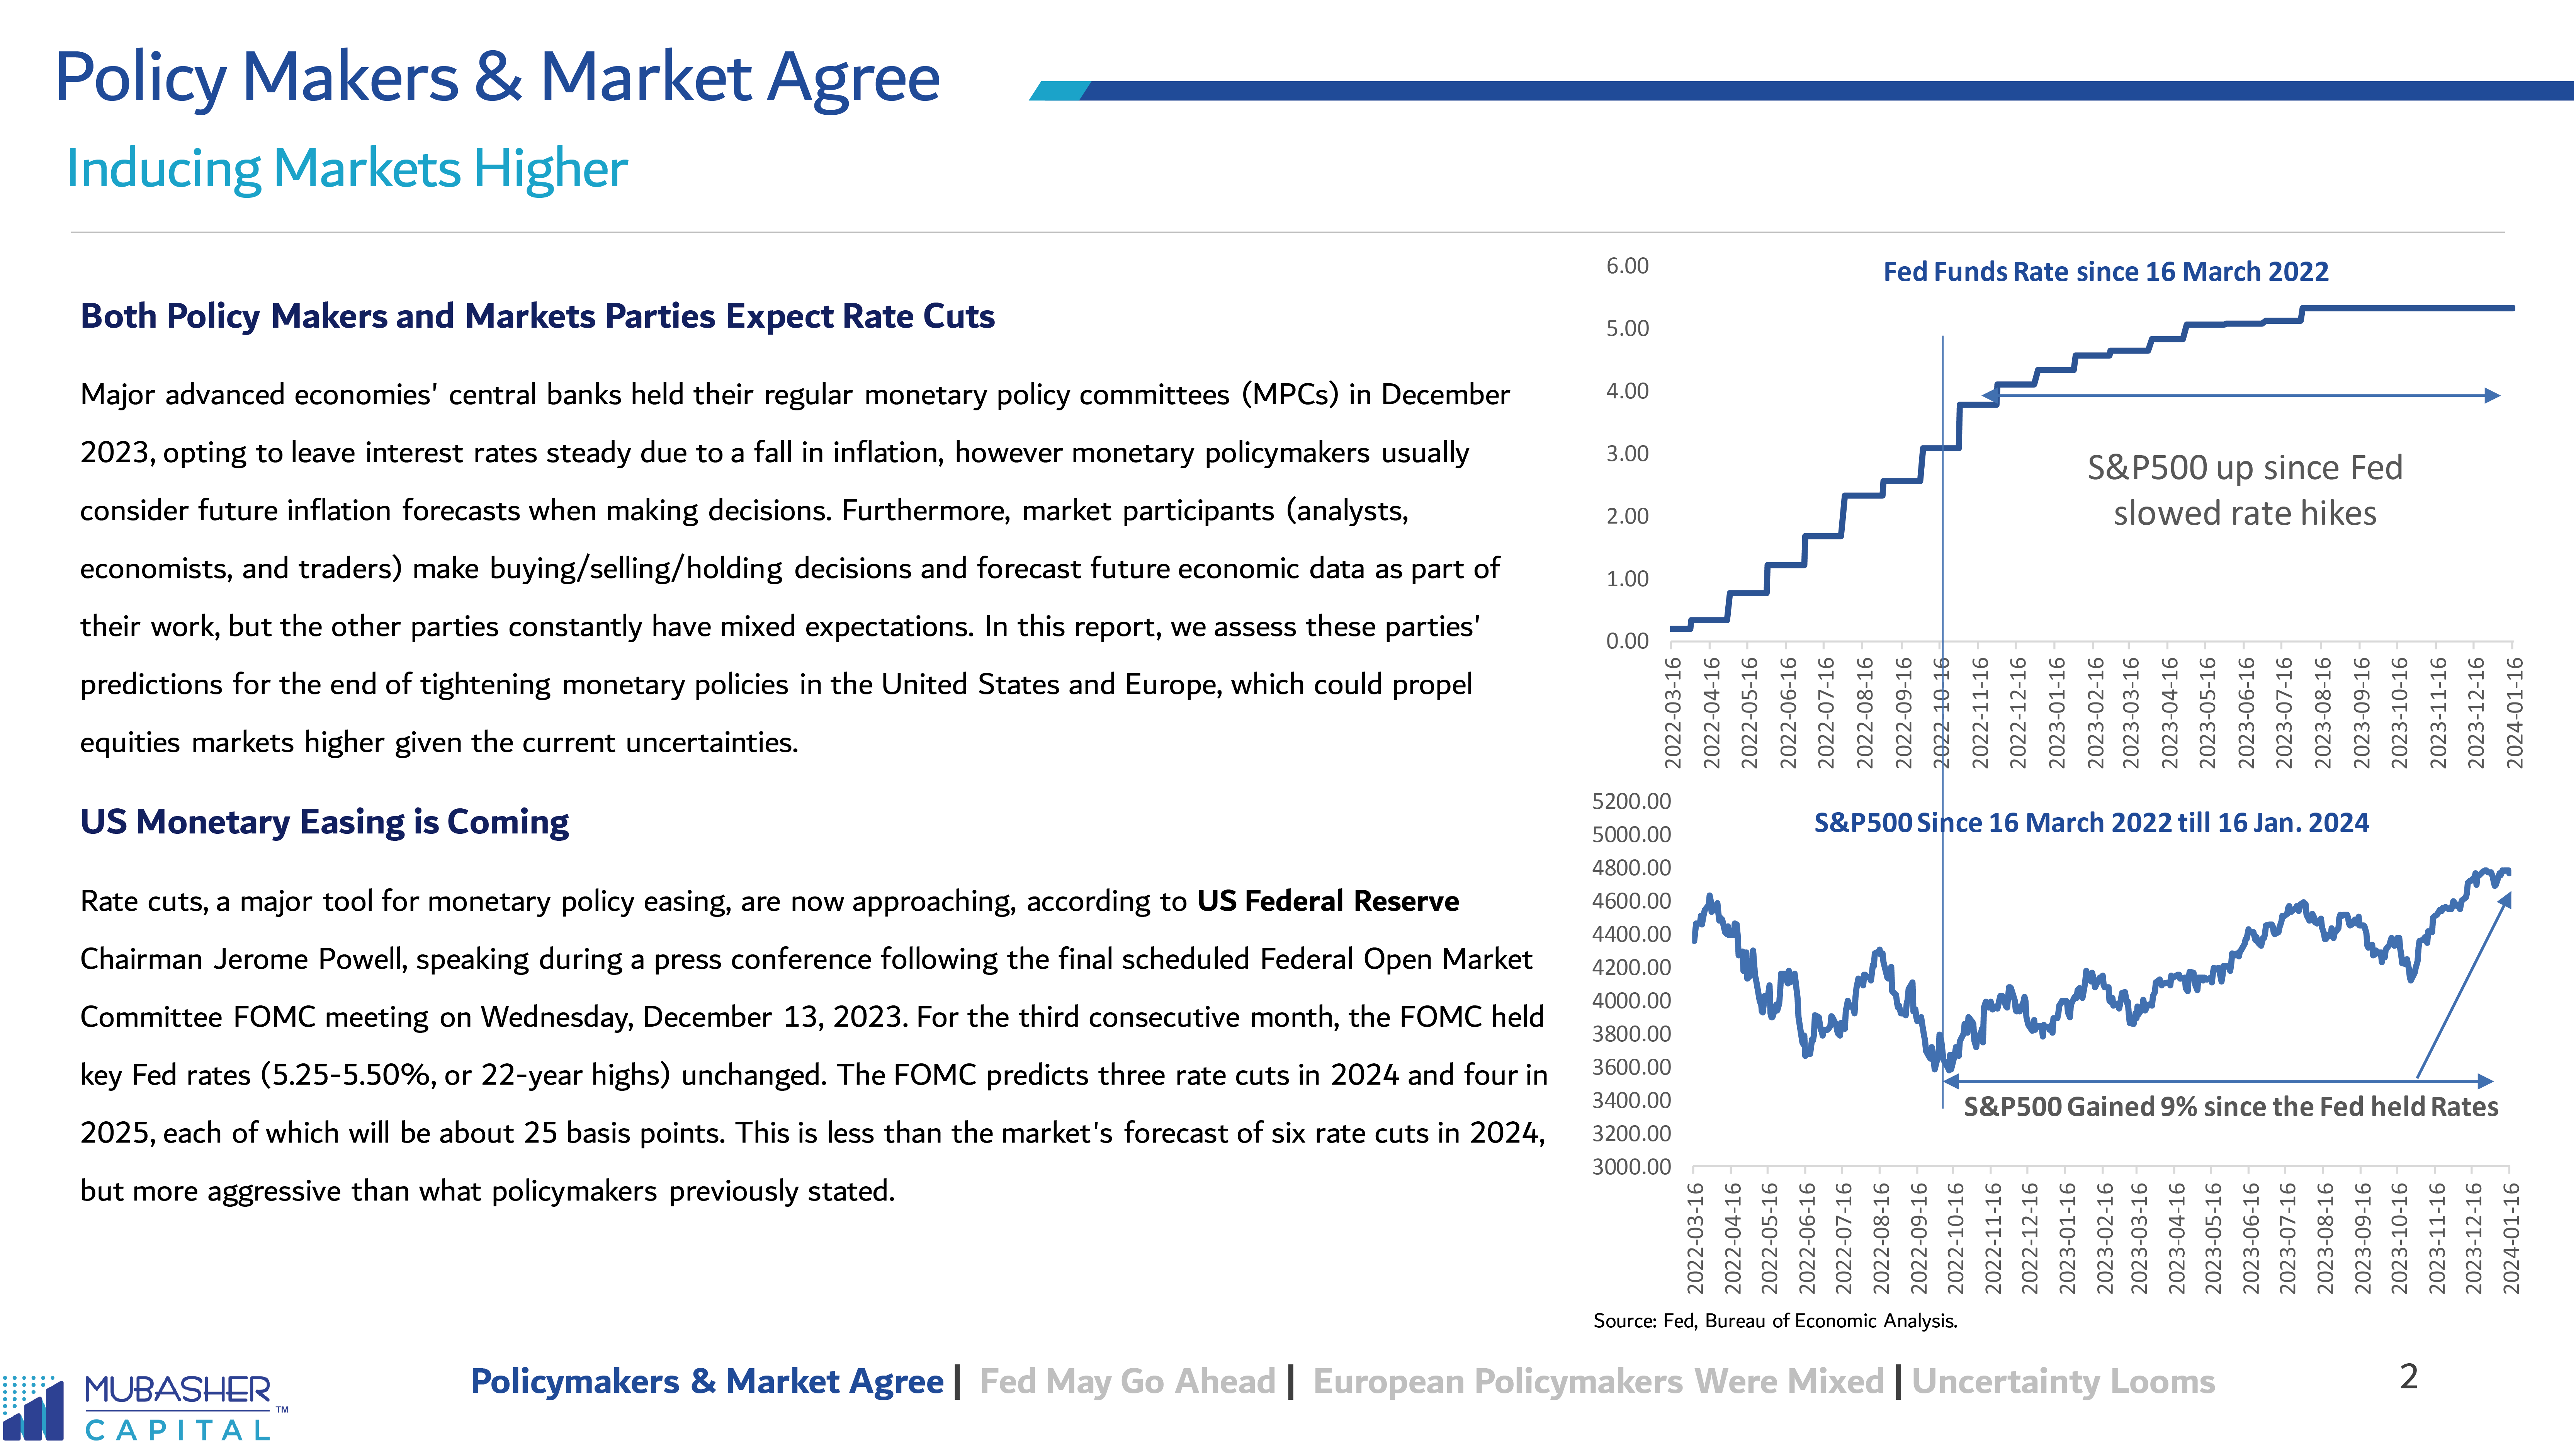
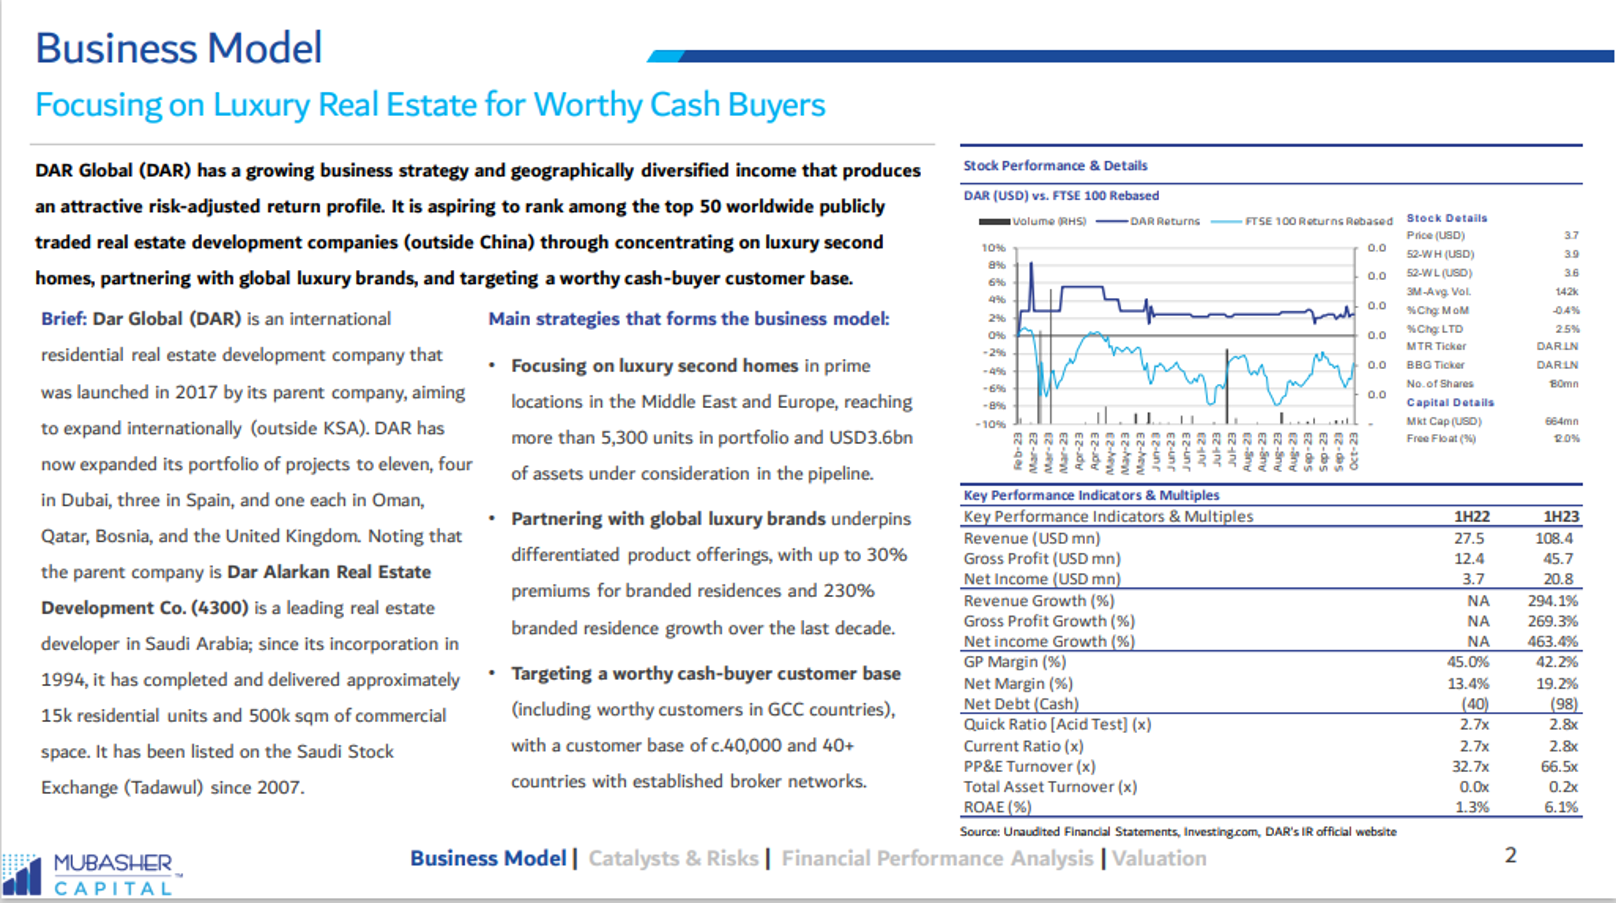
Modern Mills company (MMC), one of main four pillars in Saudi Arabia wheat milling industry, is selling 30% stake (24.5mn shares) in Tadawul market. The IPO had a price range of SAR44-48 per share and a market value of SAR1.2bn based on maximum offering price. We valued MMC at SAR68.9/share (+50% expected upside to the IPO offering price mid range), using DCF and relative valuation models.
Modern Mills company (MMC) is a trailblazer in the grain milling landscape, setting new standards for excellence and efficiency. MMC is set to help the Kingdom strengthen its food security, by providing and producing flour products in different regions of the Kingdom.
Recently, Saudi Arabia split the government-managed flour milling industry into four companies and sold them to the private sector. First Milling Co. was the first to go public in May 2023 in a USD266mn IPO.
IPO highlights: MMC is offering a maximum of 24.5mn shares (30%) of its shares, for sale through an IPO in Saudi capital market. Mada International Holding Company (50%), Al Ghurair Foods (45%) and Masafi Co. (5%) will sell around 24mn shares of their ownership. The Final Offer Price will be set within a range between SAR 44 – 48 per share, implying an offer size of c. SAR1.2bn.
Around 22.1mn shares (90% of IPO shares) will be offered to institutional investors. Around 2.5mn shares (10% of IPO) will be offered to retail investors.
Use of Offering Proceeds: Around SAR41mn (exclusive of VAT) of the total offering proceeds will be used to settle all expenses related to the offering, including the fees paid to the Saudi Exchange Company and the Securities Depositary Center Company.
The Offering Proceeds will be distributed to the selling shareholders pro-rata, based on the number of offered shares to be sold by each of them in the offering. The Company will not receive any part of the net offering proceeds. The selling shareholders will bear all fees, expenses and costs related to the Offering.
Offering Details
| Important Dates | Description |
| 15-Feb-24 | Price range announcemnt |
| 15-Feb-24 | Start of institutional book building |
| 21-Feb-24 | End of institutional book building |
| | Price announcement |
| 5-Feb-24 | Starting date for retail subscription |
| 6-Feb-24 | Last date for retail subscription (Retail offering) |
| Other Highlights | |
| Offering price (SAR/share) | (44-48) |
| Shares offered (mn shares) | 24.5 |
| Offering size (SARmn)* | 1,178 |
| Institutional / Retail Tranches (% of total offering) | 90%/10% |
Summary KPI’s
| FY End: Dec (SARmn) | FY20a | FY21a | FY22a |
| Revenue | 435 | 555 | 978 |
| Gross profit | 138 | 162 | 366 |
| EBITDA | 120 | 141 | 324 |
| Net Income | 65 | 80 | 233 |
| Revenue Growth (%) | NA | 28% | 76% |
| GP Growth (%) | NA | 18% | 125% |
| EBITDA Growth (%) | NA | 18% | 130% |
| Net Income Growth (%) | NA | 22% | 193% |
| GP Margin (%) | 31.7% | 29.3% | 37.4% |
| EBITDA Margin (%) | 27.5% | 25.4% | 33.2% |
| Net Profit Margin (%) | 14.9% | 14.3% | 23.8% |
| Net Debt (Cash) | -345 | 598 | 462 |
| EPS (SAR) | 0.72 | 9.72 | 28.47 |
| BVPS (SAR) | 12.65 | 11.96 | 21.80 |
| PER (x) | 66.5x | 4.9x | 1.7x |
| PBV (x) | 3.8x | 4.0x | 2.2x |
| ROE (%) | 6% | 81% | 131% |
MCC Company Profile
Market Pillar in Wheat Milling Industry
MMC is a Saudi joint-stock company that was initially established under the Saudi Grains Organization in 1972. MMC was previously known as “Third Milling Company” or “MC3” and was owned by the Public Investment Fund. It was subsequently acquired for SAR818mn by a consortium that includes MADA Holding and UAE-based Al Ghurair Foods in 2021. Following this merger, the new ownership structure of the Company became as follows: Mada International Holding Company (50%), Al Ghurair Foods (45%), and Masafi Co. (5%).
MMC main activities are as follows: wheat packing and milling; barley packing and milling; manufacture of concentrated animal fodder; wholesale of barley; wholesale of bakery products; retail sale of barley; and storage in ports, customs areas, or free zones.
MMC revenues by products include:
- Flour products: MMC manufactures flour products aimed at promoting food security within the Kingdom, with a primary focus on meeting the demands of end users such as: 1) Industrial & B2B (3.1% of total revenues), 2) bakeries, hospitality, restaurant and café (HORECA) (88.1% of total revenues), and 3) households (8.9% of total revenues). The flour products are available in both packaged and bulk formats, offering a range of pack sizes from 1 kg to 45 kg.
- Animal feed products: Under the established feed brand name Premier, MMC prides itself on formulating high quality animal feed products with animal productivity and health as a top priority without compromising feed ingredients or quality. MMC produces a range of specialty poultry and livestock animal feed. Animal feed is typically sold in large packs of 40kg and 50kg to wholesalers and poultry farms, The pricing of animal feed products is not regulated which has yielded superior profit margins.
- Animal bran is produced as a by-product of the flour milling process. MMC produces wheat bran for animal use in large packs of 40kg and in bulk and uses the majority of produced bran in internal animal feed production and sells the remaining part to appointed distributors, who then sell animal bran products to small livestock farms, and feed producers. The pricing of animal bran products is not regulated.
Production facilities: MMC is headquartered in Jeddah and its production facilities are located in three regions across the Kingdom, in Al-Jumum, Khamis Mushait and Al-Jouf, with a current aggregate milling capacity of 3,450 tons per day (1.1mn ton per annum) and a feed plant capacity of 1,400 tons per day (368k tons / annum).
MMC plans to double the milling capacity at the Al-Jumum facility from 1,200 per day to 2,450 per day by 2025 by installing an additional milling line with a daily production capacity of 1,250 (which would be the largest in the Kingdom) in order to meet increasing demand in the Western region which driven by Hajj and Umrah.
MMC plans to increase productivity at its Khamis Mushait facility by upgrading of one of its mills with new, best in- class equipment, which will raise its production capacity from 1,650 per day to 1,800 per day.

MMC Business Model
Meeting the Demand from Kernel to Bag
Pricing scheme of flour: Based on Wheat Supply Agreement “WSA”, MMC purchases its main raw material, wheat, from its key supplier, the GFSA, which is the regulator in KSA that sells wheat to milling companies at a government subsidized price in accordance with the Subsidized and Unsubsidized Flour Supply Agreement that will be concluded with the Company on 12 July FY25.
Following the Company’s privatization in FY20, the GFSA committed to maintaining a price difference of SAR320per ton between the unified purchase cost of wheat (SAR180per ton) from all member countries and the selling price of flour products to end-users (around SAR500per ton depending on bulk packaging or 45 kg packs).
Accordingly, there might be 3 possible scenarios:
1- The existing subsidy scheme will remain unchanged: The current situation regarding the sale price of flour to end users and commitment to price differential by the GFSA remains as is.
2- The subsidy will be gradually phased out: The GFSA’s commitment to maintaining the price differential between the unified purchase cost of wheat from all member countries and the selling price of flour to end-users applies only to flour used in the production of bread.
3- Complete elimination of the subsidy: The Government will entirely eliminate the subsidy on all varieties of wheat and flour products in the market.
In scenario no. 2 & 3, MMC might seek alternative international suppliers to provide raw materials at global market prices without subsidies which might make the company face additional costs, potentially impacting its margins and overall profitability significantly.
Its’s worth mentioning that, MMC source around 42% of its flour needs from GFSA at the subsidized prices in 1H23.
Diversified portfolio: It’s worth mentioning that, MMC launched a set of retail brands, Qamhati which is top-tier flour brand offering a premium quality flour that produces professional grade baking results. Modern Mills is the Company’s mid-tier flour brand. Qoot & Root is the Company’s lower tier flour brand offering good quality at a lower price for everyday use.
MMC is also working to develop other value-added and higher margin products adjacent to its current product range, such as ready mixes and gluten-free flour, and to expand into additional product categories.
MMC hold a market share of 24%, and 7% in flour and feed, respectively.
Revenues growth: Revenues of flour products comprised 41% and 46% of the Company’s total revenues for FY22 and the 1H23, respectively. Revenue of flour products grew by 43% between 2020 and 2022, reflecting the result of the: 1) increase of quantities sold in various branches, 2) the enhancement of the market share in the sales areas during the Hajj and Umrah season and, 3) the return to school starting 3QFY21.
Feed revenues increased by 116.2% from SAR91.8mn in 2020 to SAR198.4mn in 2021, mainly driven by the increase in volumes sold by 52.4k tons from an improvement in market share for poultry following the adoption of a new strategy focusing on improved recipes to attract more customers, in addition to the increase in gross average revenue per ton by SAR387 on the back of the change in feed pricing strategy.
Revenue Segmentation
| Revenues by type (SAR in mn) | FY20a | FY21a | FY22a |
| Flour | 281 | 279 | 402 |
| As % of total Revenue | 65% | 50% | 41% |
| Feed | 92 | 198 | 400 |
| As % of total Revenue | 21% | 36% | 41% |
| Animal Bran | 63 | 78 | 176 |
| As % of total Revenue | 14% | 14% | 18% |
| Total | 435 | 555 | 978 |
| Revenues Breakdown | Unit | FY20 | FY21 | FY22 |
| Flour | | | | |
| Price/ton | | 529.4 | 509.9 | 500.7 |
| Growth | % | NA | -4% | -2% |
| Volume | 000 ton | 530.8 | 547.5 | 802.9 |
| Growth | % | NA | 3% | 47% |
| Revenues | SAR mn | 281 | 279 | 402 |
| Growth | % | NA | -1% | 44% |
| As % of Total Revenue | % | 65% | 50% | 41% |
| Feed | | | | |
| Price/ton | | 841.2 | 1,228.5 | 1,625.6 |
| Growth | % | NA | 46% | 32% |
| Volume | 000 ton | 109.1 | 161.5 | 246.0 |
| Growth | % | NA | 48% | 52% |
| Revenues | SAR mn | 92 | 198 | 400 |
| Growth | % | NA | 116% | 102% |
| As % of Total Revenue | % | 21% | 36% | 41% |
| Animal Bran | | | | |
| Price/ton | | 582.5 | 708.4 | 990.2 |
| Growth | % | NA | 22% | 40% |
| Volume | 000 ton | 107.3 | 109.4 | 177.8 |
| Growth | % | NA | 2% | 63% |
| Revenues | SAR mn | 63 | 78 | 176 |
| Growth | % | NA | 24% | 127% |
| As % of Total Revenue | % | 14% | 14% | 18% |
| Total | | | | |
| AVG Price/ton | | 582.5 | 678.2 | 797.2 |
| Growth | % | NA | 16% | 18% |
| Volume | 000 ton | 747 | 818 | 1,227 |
| Growth | % | NA | 10% | 50% |
| Revenues | SAR mn | 435 | 555 | 978 |
| Growth | % | NA | 28% | 76% |
White Flour Industry Overview
Solidly Grounded Sectors
Wheat flour market: Coupled with the Kingdom’s ongoing privatization efforts, food security ambitions have fostered a growth environment for the supply side of the food production and manufacturing sector. Saudi Arabia›s privatization efforts have extended to sectors within the country’s food supply chain. This move which began with the privatization of the four flour mills originally grouped by the Government, namely, MC1 (Now First Mills Company), MC2, MC3 (Now MMC), and MC4 extended into broader initiatives like the USD10bn (SAR37.5bn) Food Security Plan in 2022.
Traditionally, GFSA has been responsible for sourcing, storage and distribution of food-grade wheat. The Saudi wheat flour milling industry is undergoing transformation as the GFSA shifts toward a regulatory and quality inspection role, while the Saudi Agricultural and Livestock Investment Company (SALIC) is expected to lead sourcing and storage of food-grade wheat.
Overall consumption was led mainly by bakeries and food manufacturers which mainly purchase 80% bakery type wheat flour in 45kg bags or in bulk volumes weighing more than 45kg. GFSA subsidizes wheat prices and regulates wheat flour prices in 45kg bags and bulk volumes, supplying registered bakeries and food businesses through distributors. Prices for 45kg bags vary from SAR 22 to SAR 30 per bag depending on the flour type.

Animal feed market In Saudi Arabia, demand for total compound animal feed in the accessible market surged by 16% in 2020 due to increased local poultry and red meat production during the pandemic, to reach 3.69mn tons. In 2020, subsidies on barley were removed, and the VAT rate was raised from 5% to 15%. Direct financial assistance was introduced for small-scale livestock and poultry farmers with a maximum of 300 animals, promoting nutrient-rich total compound animal feed.
As a result, value market size spiked by 20.6% to reach SAR4.27bn in 2020. However, in 2021, the pandemic›s lingering effects and global rising costs led to a 10.8% decline in demand, forcing many small farmers out of the market. This resulted in the market dropping to 3.29mn tons with an equivalent value market size of SAR4.39bn in 2021. The accessible total compound animal feed market is projected to grow at a 4.7% CAGR to reach around 5.1mn tons by 2030.
Competition positioning: MC1 in Jeddah enjoys cost-saving advantages due to its proximity to a flour mill and primarily focuses on livestock feed. MC2 and MC4, with daily production capacities of 600 and 300 tonnes, respectively, also emphasize livestock feed, serving different regions.
Categories in feed consumption (‘mn ton)

Market share by value

Source: IPO Prospectus
MMC Valuation
Expected Upside potential of 50%
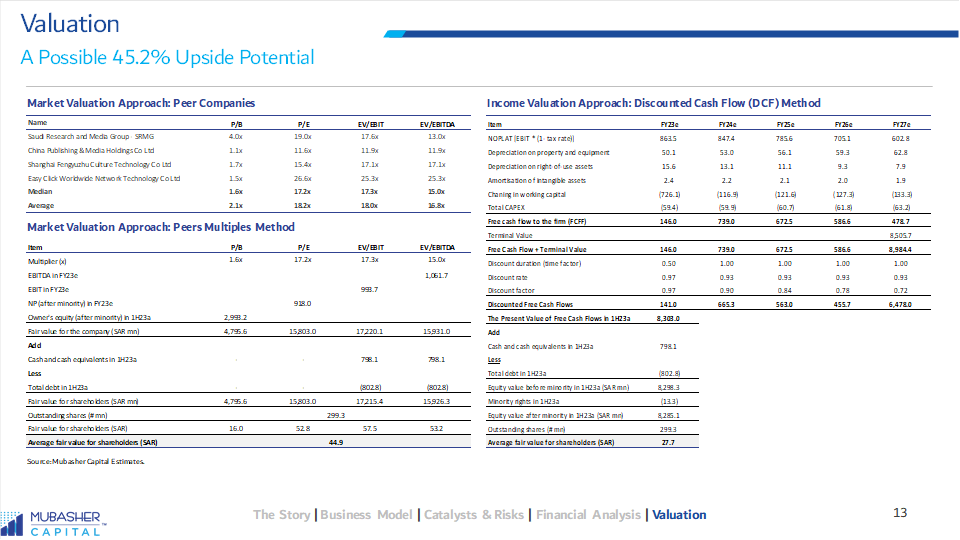
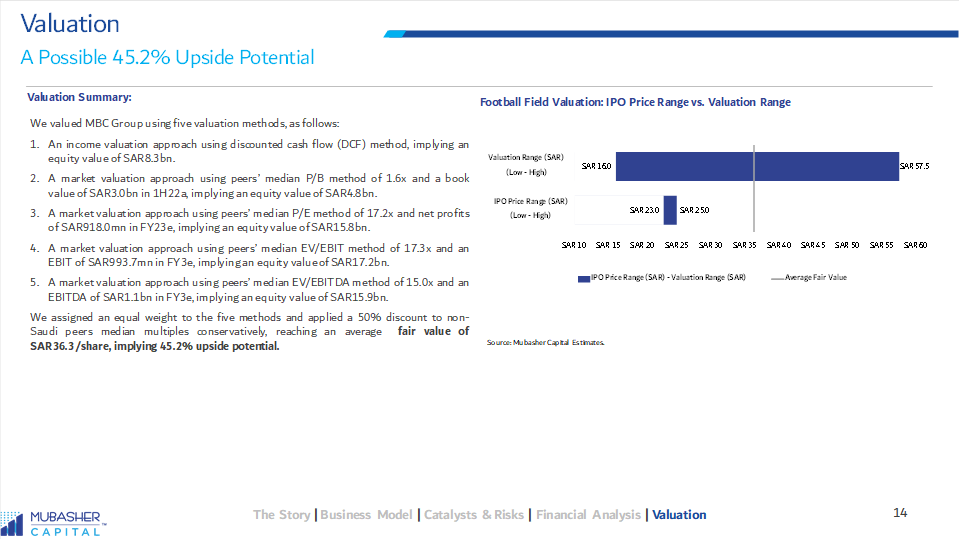
Our AVG FV stands at SAR 68.9/share: Furthermore, alongside employing a discounted cash flow (DCF) model that yielded a FV of SAR82.6 per share, as illustrated in the corresponding table, an alternative valuation approach was undertaken through a relative valuation. This involved utilizing the median P/E and EV/EBITDA multiples for FY24 pertaining to F&B companies in Saudi Arabia.
The median P/E and EV/EBITDA multiples derived from analogous emerging markets peers were applied to MMC expected earnings and EBITDA for the FY24 to ascertain a fair value for the company’s stock. Assigning equal weights to both valuation methodologies resulted in an average fair value of SAR68.9 per share, signifying a 50% increase compared to the IPO mid point offer price of SAR46 per share.
DCF – fair value SAR 82.6/ share: We discounted MMC’s free cash Flow to the firm (FCFF) over the coming five years (2024-2028) based on the following assumptions:
- Revenues to grow at a 5-Year CAGR of 8.9% to SAR1.4bn by 2028 due to increasing capacity in 2025 and the high demand from hajj and Umrah.
- EBITDA to grow at a 5-Year CAGR of 5.7% to SAR438mn by 2028, with EBITDA margin to stand at 31% on average during the forecasted period, in parallel with MMC historical average.
- AVG CapEx as % of revenues of 3.4% in the forecast period, except for FY24 as the company to expand Al-Jumum capacity with estimated CapeEx of SAR200mn.
- Working capital assumptions are based on historical averages cash conversion cycle (CCC).
- Cost of Equity (COE) is 8.2%, calculated as follows: KSA implied risk-free rate of 3.1% on average during forecasted period (based on US risk free rate and inflation differential between KSA vs. USA), KSA’s Equity Risk Premium (ERP) of 6.3% (based on a US market ERP of 5.94% and a relative standard deviation of 1.06 between US and KSA equity markets returns), and a Beta of 0.8.
- After tax cost of debt 5% on average.
- Capital structure of AVG 76% equity and 24% debt, based on the market value of MMC equity of SAR1.2bn (based on the IPO max price).
- Hence, we used a WACC of 7.7% in 2024e, which eventually declines to 7.1% by 2028e, with terminal year growth rate of 3%.
DCF Valuation
| SAR mn, except per-share figures | FY24e | FY25e | FY26e | FY27e | FY28e |
| NOPLAT | 236 | 286 | 296 | 307 | 319 |
| Non – Cash Item | 62 | 67 | 72 | 78 | 84 |
| Gross Cash flow | 298 | 353 | 369 | 385 | 403 |
| Change in Working Capital | (43) | (25) | (5) | (6) | (6) |
| CAPEX | (200) | (43) | (44) | (46) | (48) |
| FCFF | 55 | 285 | 319 | 334 | 350 |
| Terminal value (TV) | | | | | 8,801 |
| PV of FCFF | 51 | 250 | 262 | 256 | 6,564 |
| Enterprise Value | 7,383 | | | | |
| Add: Cash (9M23) | 168 | | | | |
| Add: Investments (9M23) | 0 | | | | |
| Less: Debt (9M23) | (793) | | | | |
| Equity value | 6,757 | | | | |
| Number of Shares Outstanding | 82 | | | | |
| DCF Fair Value (SAR/ share) | 82.6 | | | | |
| | | | | | |
| IPO Offer Price | 46.0 | | | | |
| +/- Pot. | 80% | | | | |
Valuation (Cont’d)
Expected Upside potential of 50%
Multiples valuation: We used Saudi Arabia F&B peers’ median P/E and EV/EBITDA FY24 multiples and applied them to MMC’s expected earnings and EBITDA in FY24 to arrive at a fair value for the stock as follows:
- P/E: Using peers’ median FY24 P/E of 26x and our forecasted net income for FY24, we arrived at a fair value of SAR60.2/ share.
- EV/EBITDA: By applying peers’ median FY24 EV/EBITDA of 18x to our forecasted FY24 EBITDA, we arrived at a fair value of SAR 63.9/ share.
- Our FV is SAR/ share based on equal weights: We assign equal weights to both valuation techniques, reaching a fair value of SAR 68.9/ share, which represents 50% higher than the IPO mid point price of SAR46per share.
Investment rationale:
- Price of animal feed or animal bran is not regulated which allows higher margins.
- Good relations (40 years) with key clients guarantees continuous future contracts.
- Catering all types of consumers through top, mid and low tier products.
- Revenues are almost 100% cash.
- High potential for exports based on the company’s strategy.
- High market share in wheat milling and feed industry of 24% and 7%, respectively.
Key Risks:
- High competition in feed industry.
- From one hand, Gradual or full removal of wheat subsidy provided by GFSA will expose MMC to higher unsubsidized wheat prices but on the other hand will allow selling flour products above the SAR500/ton cap regulated by GFSA.
- High leverage with AVG D/E of 3.6x.
- Outbreak of an infectious disease or other serious public health concerns.
- Stronger foreign currencies may lead to an increase in wheat costs (main raw material) unless the company pass the increase.
- Tighter monetary policies, such as high interest rate to fight high inflation rates may increase the finance cost.

Source: Mubasher Capital