What Is a Candlestick Patterns
If you’re interested in trading, you’ve probably heard of candlestick patterns. These patterns are a type of technical analysis used to understand market trends and predict future price movements. The name “candlestick” comes from the shape of the charts, which resemble candlesticks with a wick on top and a body below.
Candlestick patterns are an important tool for traders to use because they can show when a trend is changing, and whether an asset is likely to go up or down in value. They provide valuable information for making informed decisions and can help traders reduce risk and increase profits
Understanding Bullish and Bearish Candlestick Patterns
Before we dive into the details of trading risk management, let’s first understand what it is. Trading risk management is a set of strategies and practices that traders use to minimize their exposure to potential financial losses. It is a crucial component of any successful trading strategy. Without proper risk management, traders can easily lose all their capital in a single trade.
Risk management aims to protect traders from such catastrophic losses by limiting their exposure to risks and ensuring that they have enough capital to continue trading.
Bearish candlestick patterns, on the other hand, indicate that the price of an asset is likely to decline. These patterns are characterized by a long red or black candlestick that signals selling pressure and a bearish sentiment.
Examples of commonly recognized patterns for bearish conditions include the shooting star, the evening star, and the doji pattern.
Examples of Bullish Candlestick Patterns
Bullish Hammer Candlestick Pattern
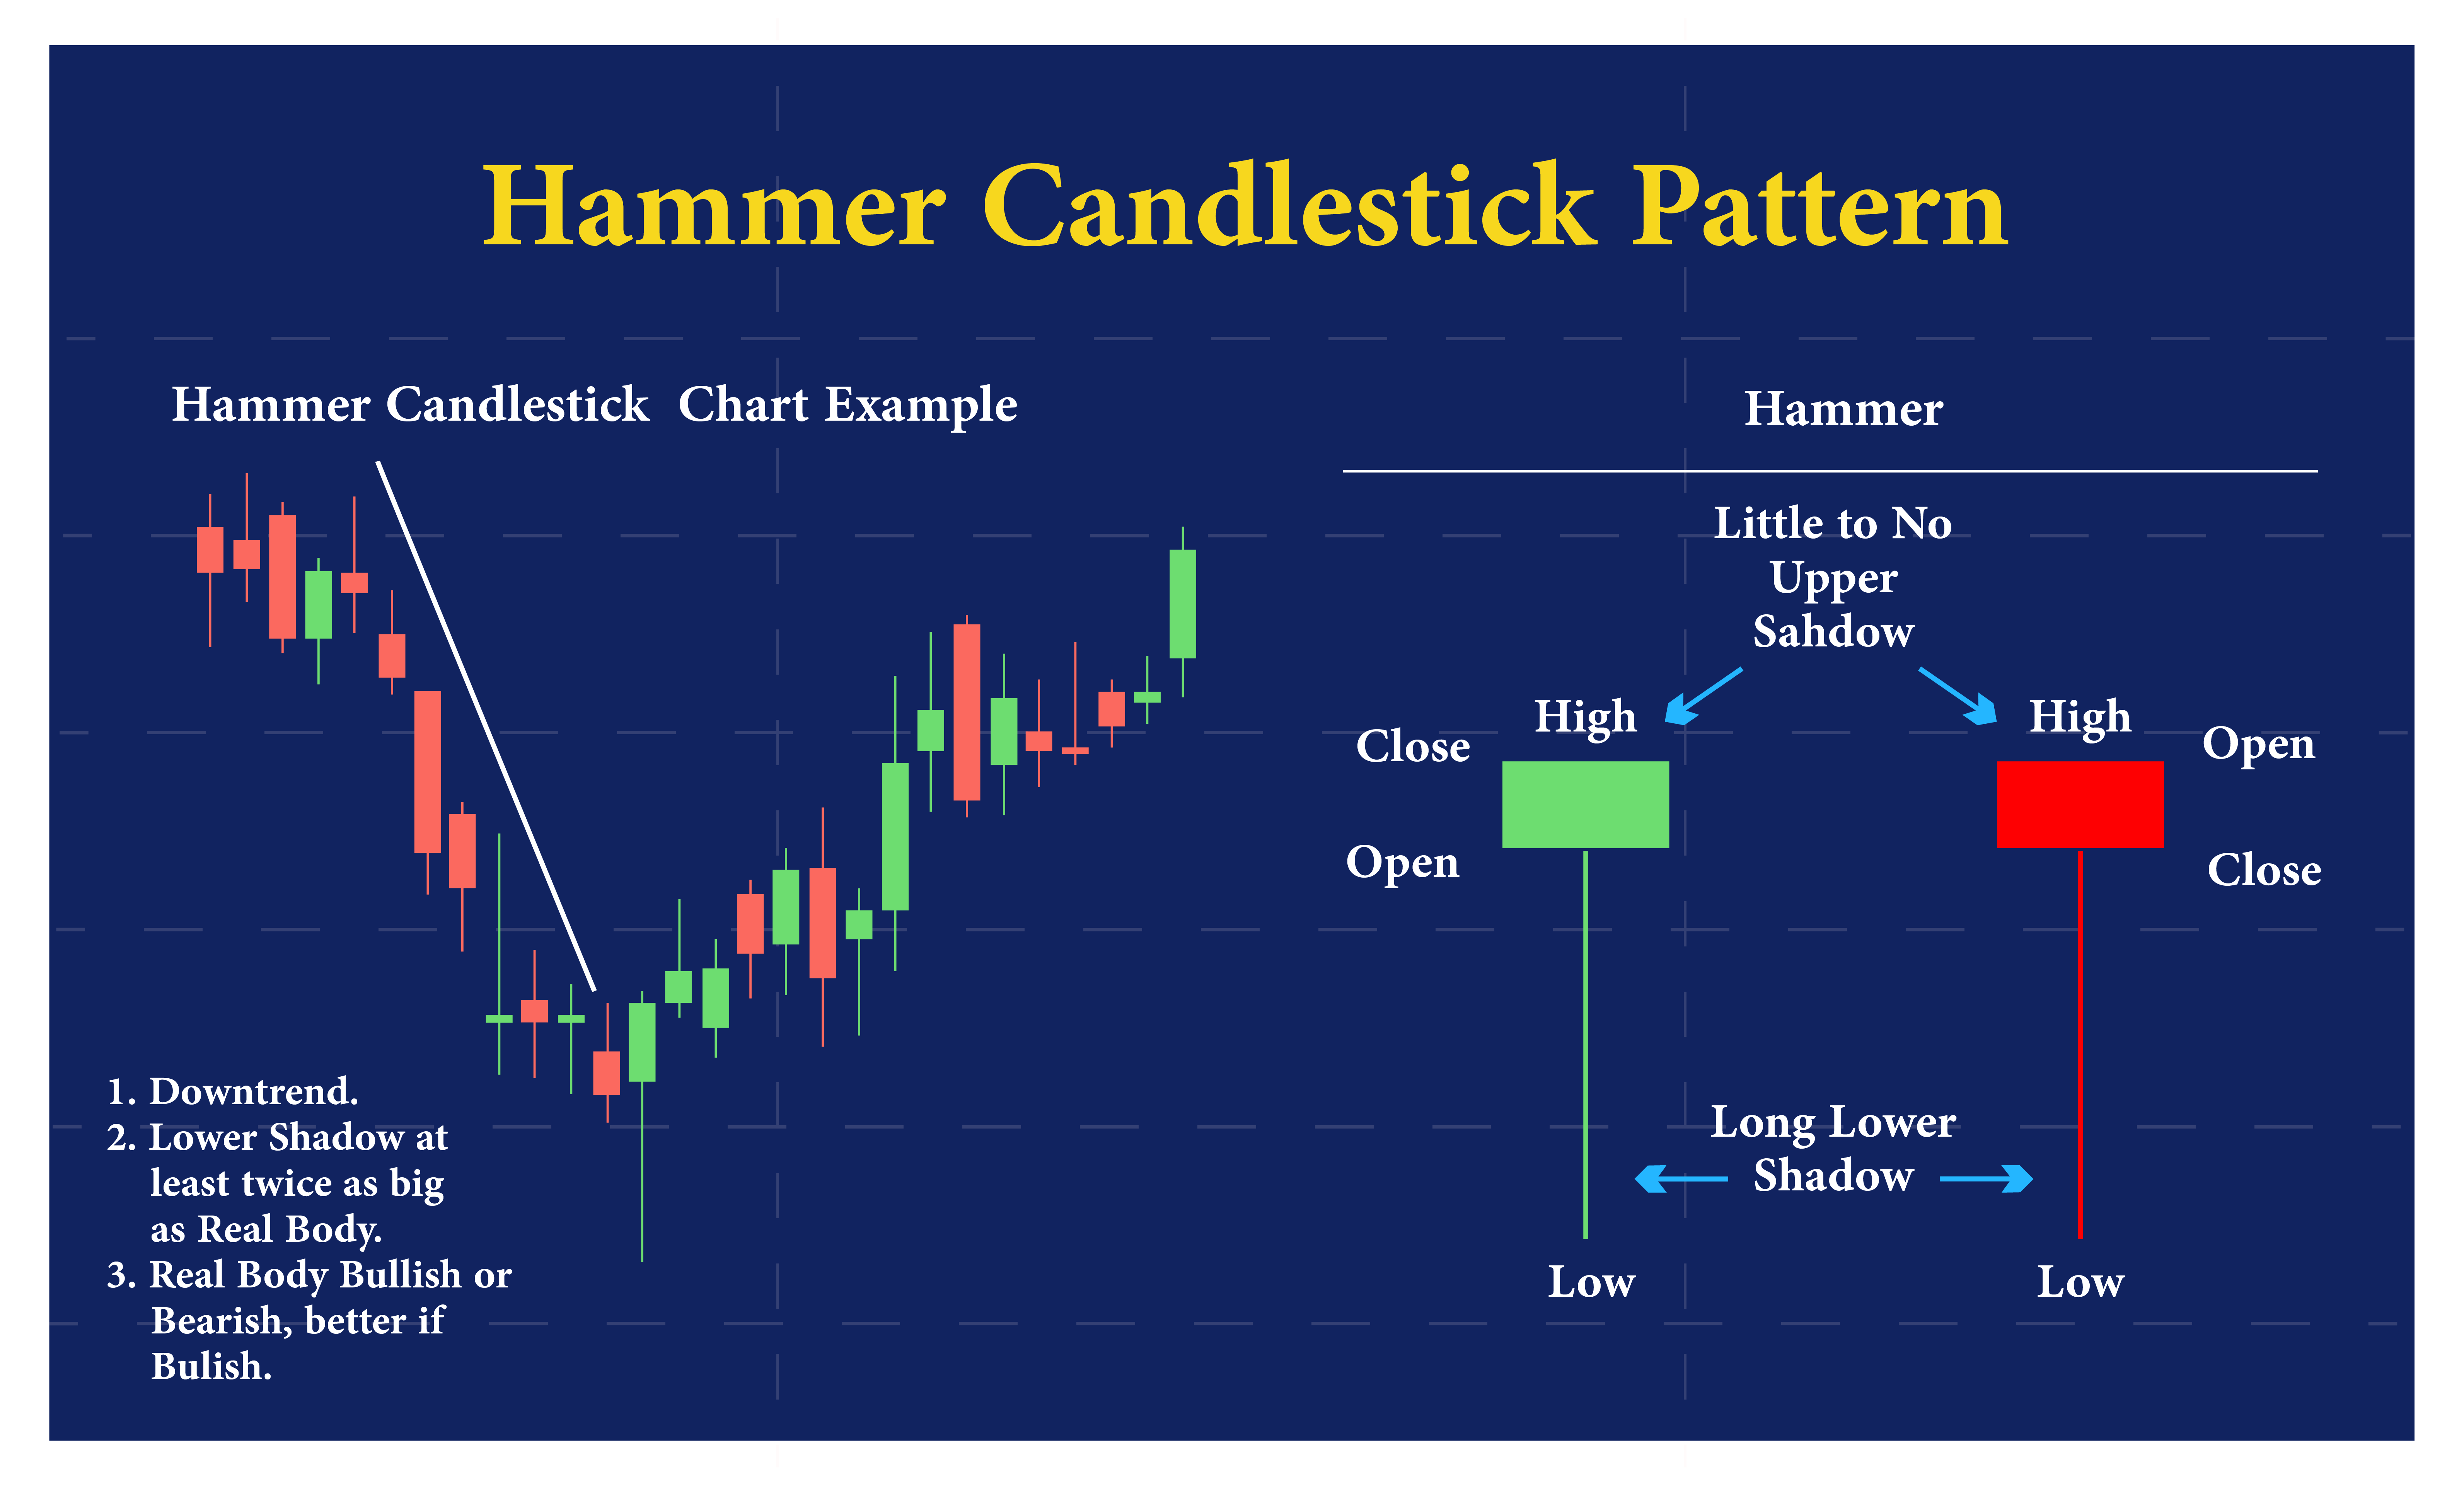
The Hammer: This pattern occurs when a candlestick has a small body and a long lower wick. It indicates that buyers are stepping in after a period of selling pressure and that the price may be ready to reverse.
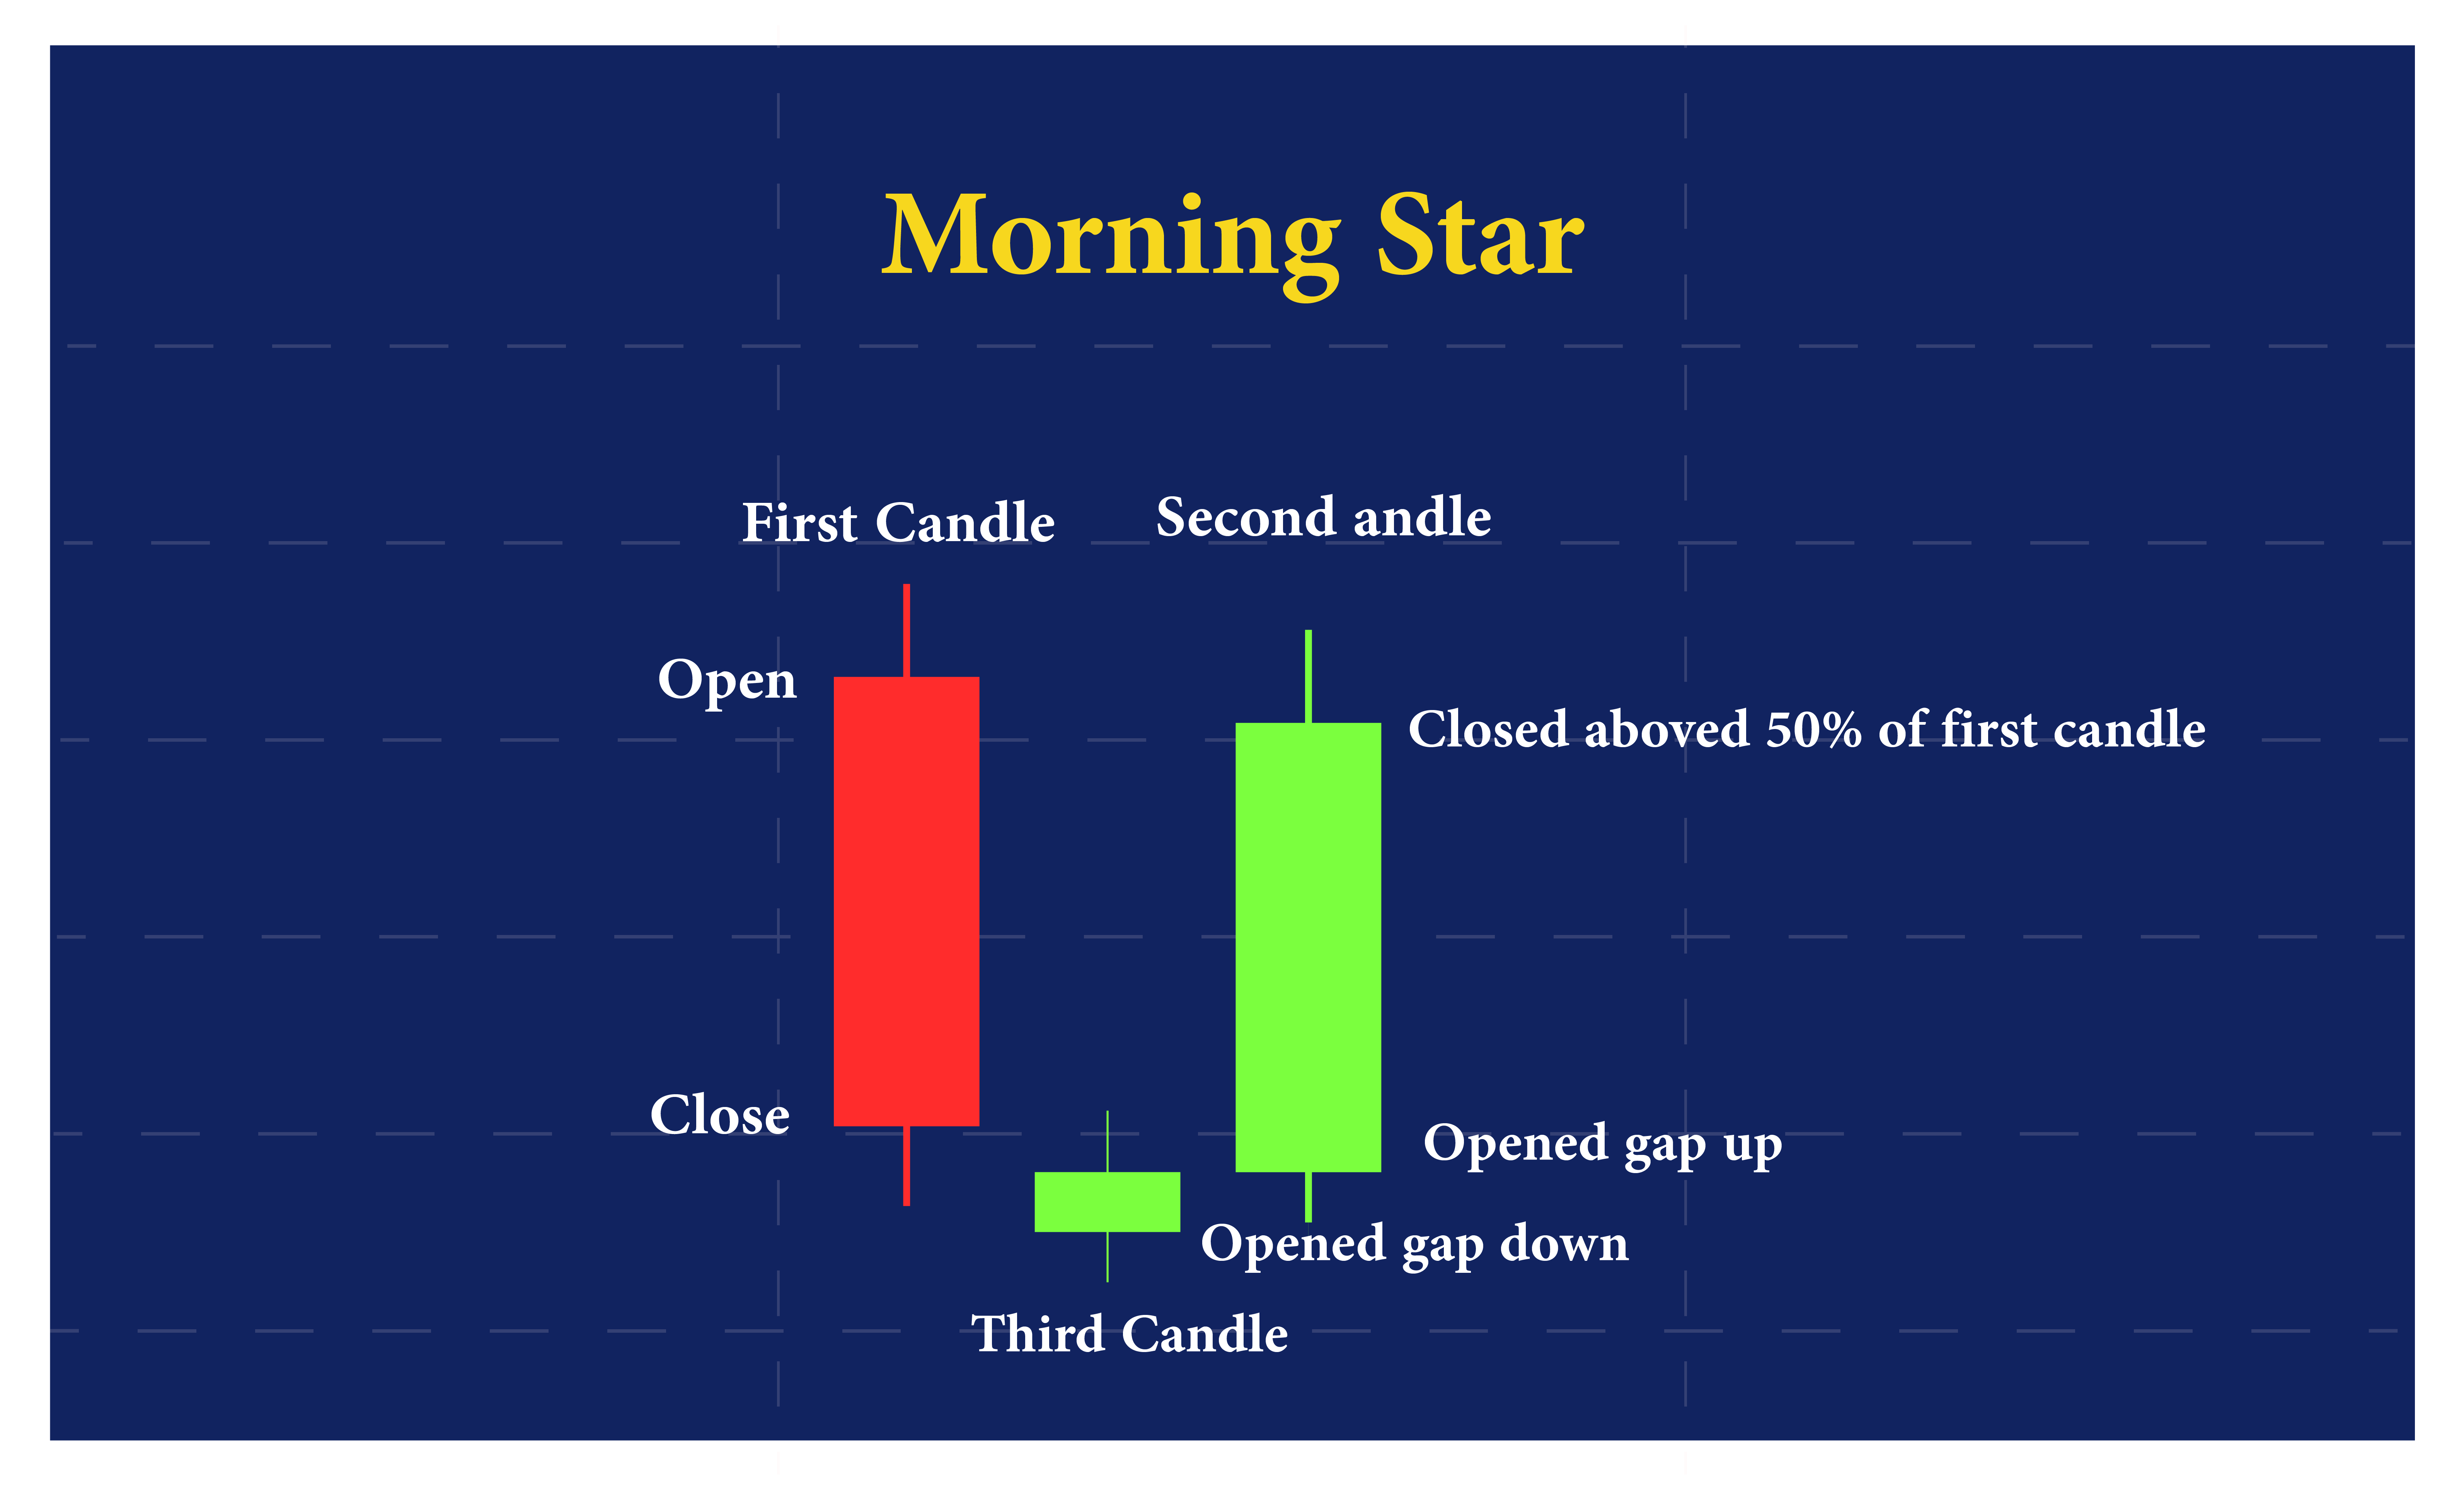
The Morning Star: This pattern is formed when a long red candlestick is followed by a small-bodied candlestick that gaps lower. The third candlestick in the pattern is a long green candlestick that closes above the midpoint of the first candlestick. It signals a potential shift in momentum from bearish to bullish.
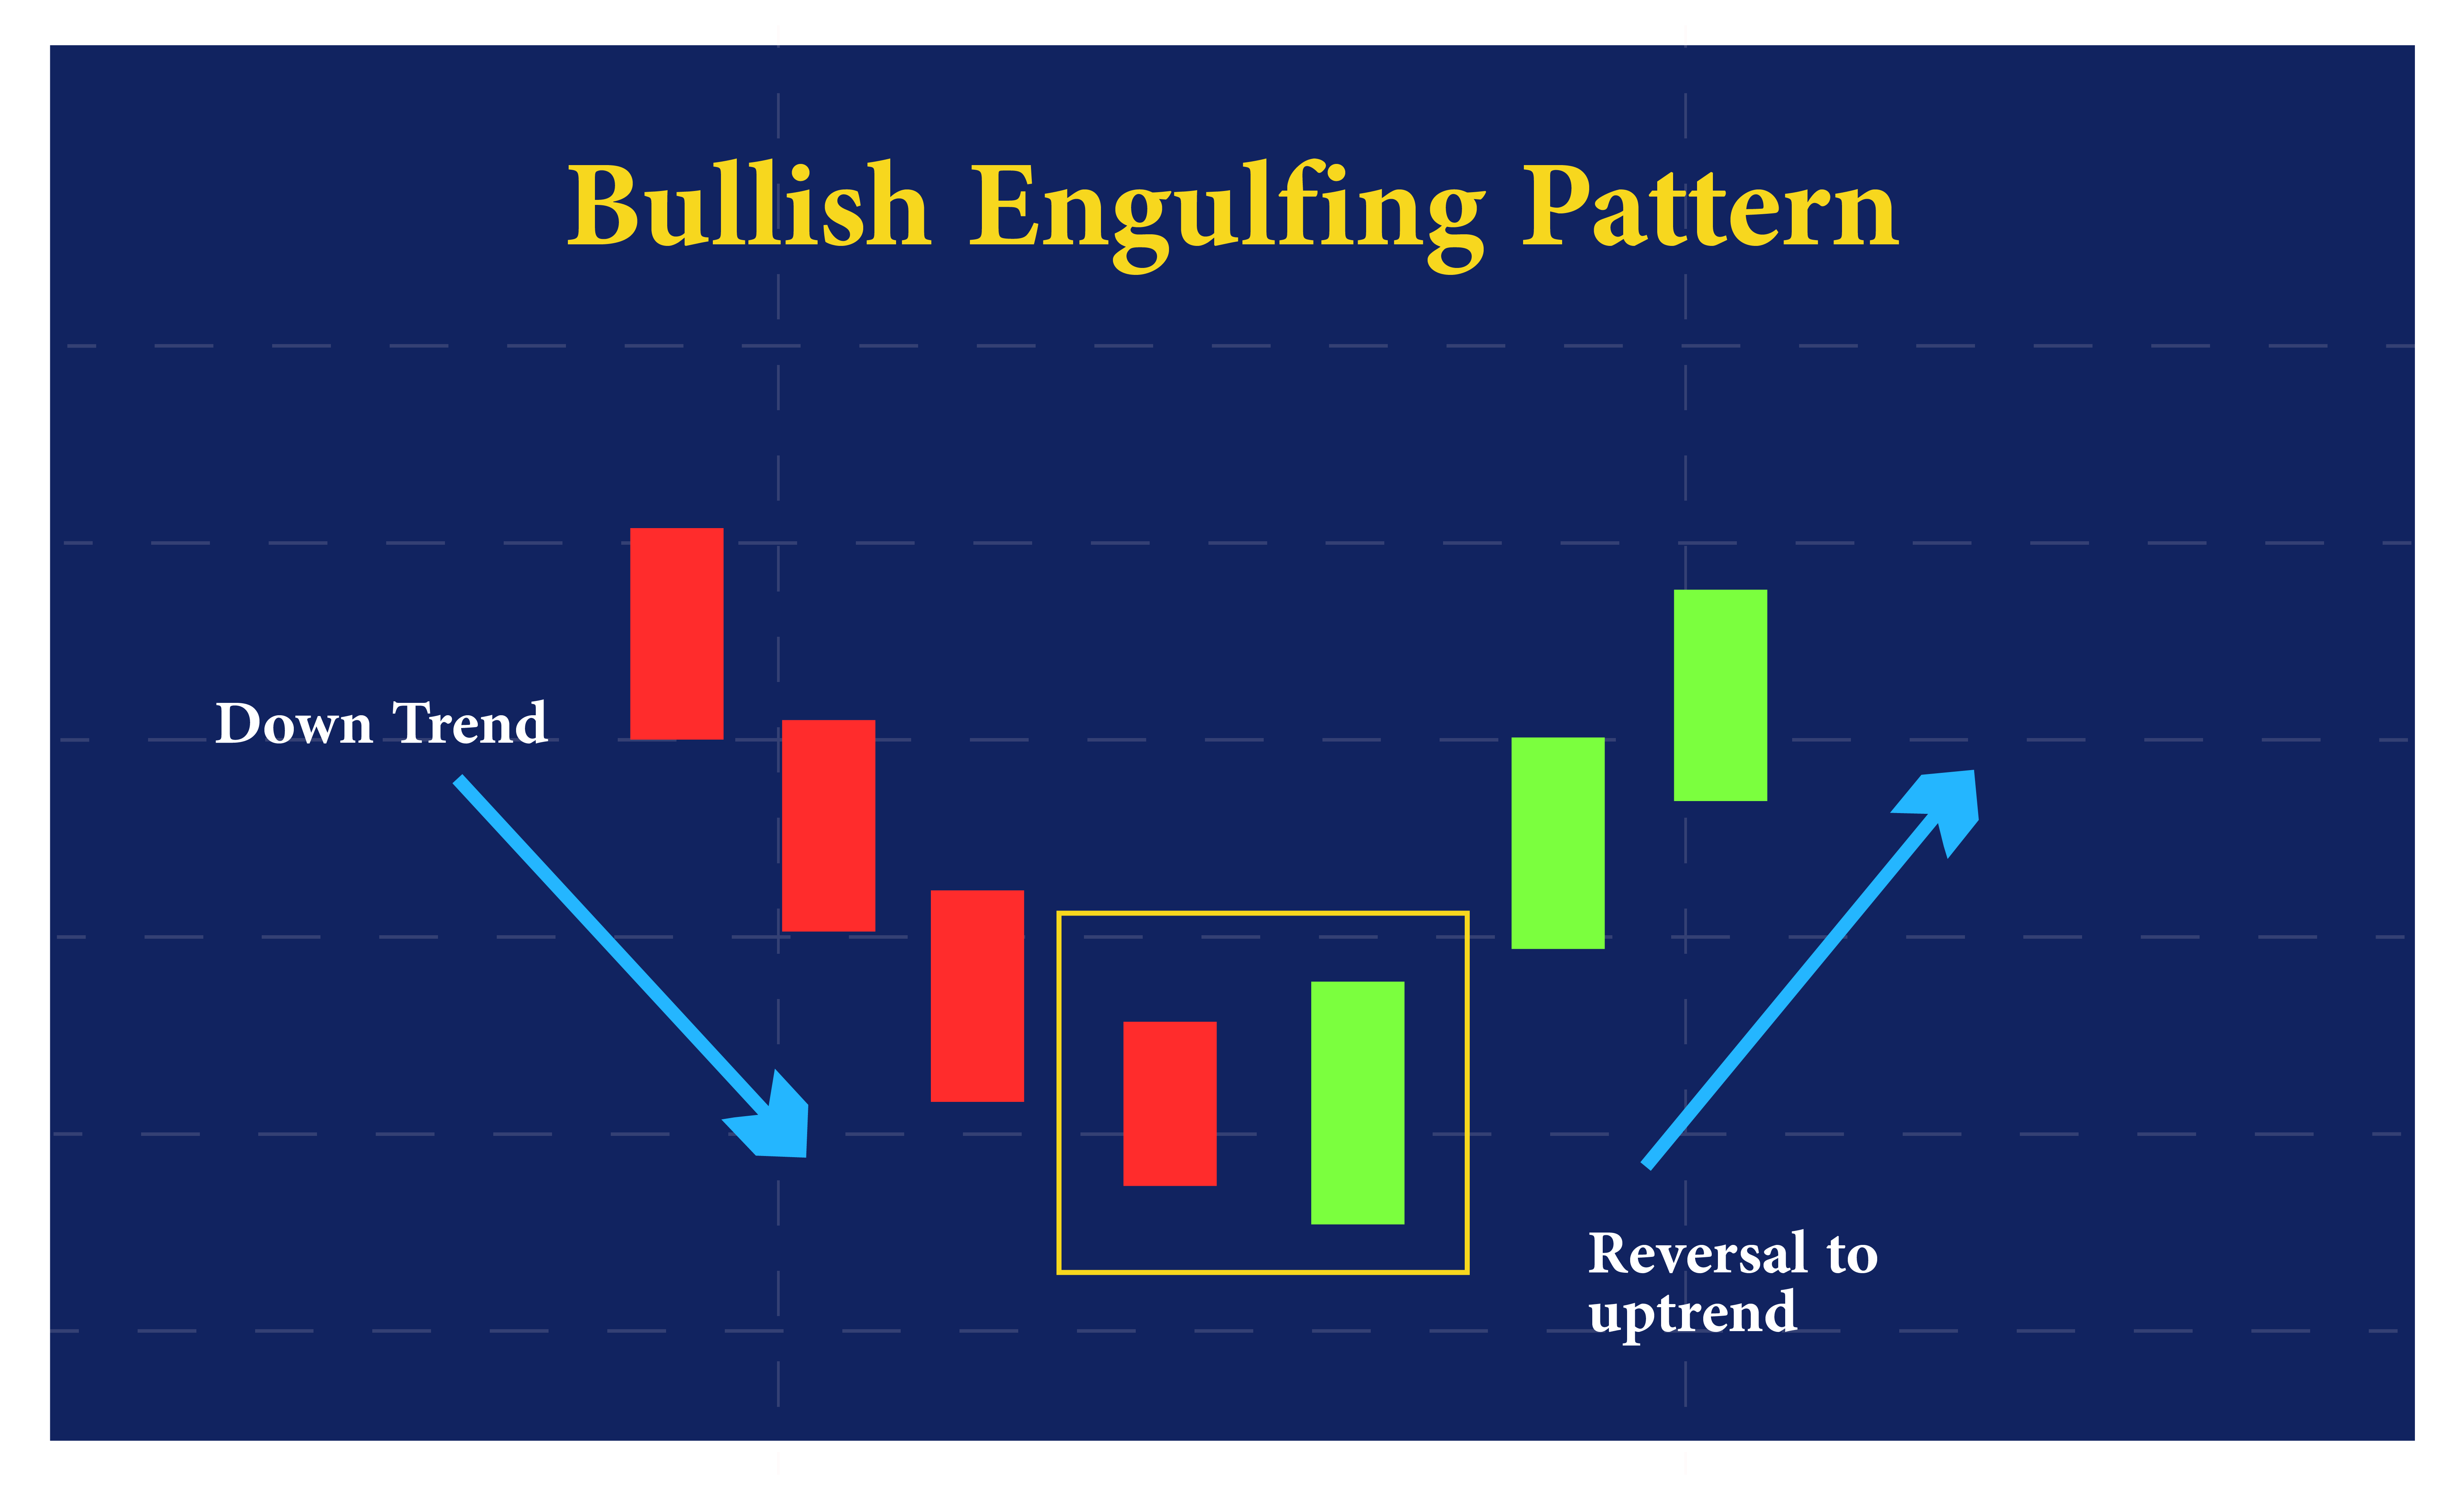
The Engulfing Pattern: This pattern occurs when a small-bodied candlestick is followed by a larger candlestick that completely engulfs the first one. It signals a reversal in sentiment and a potential shift in the direction of the price.
Examples of Bearish Candlestick Patterns
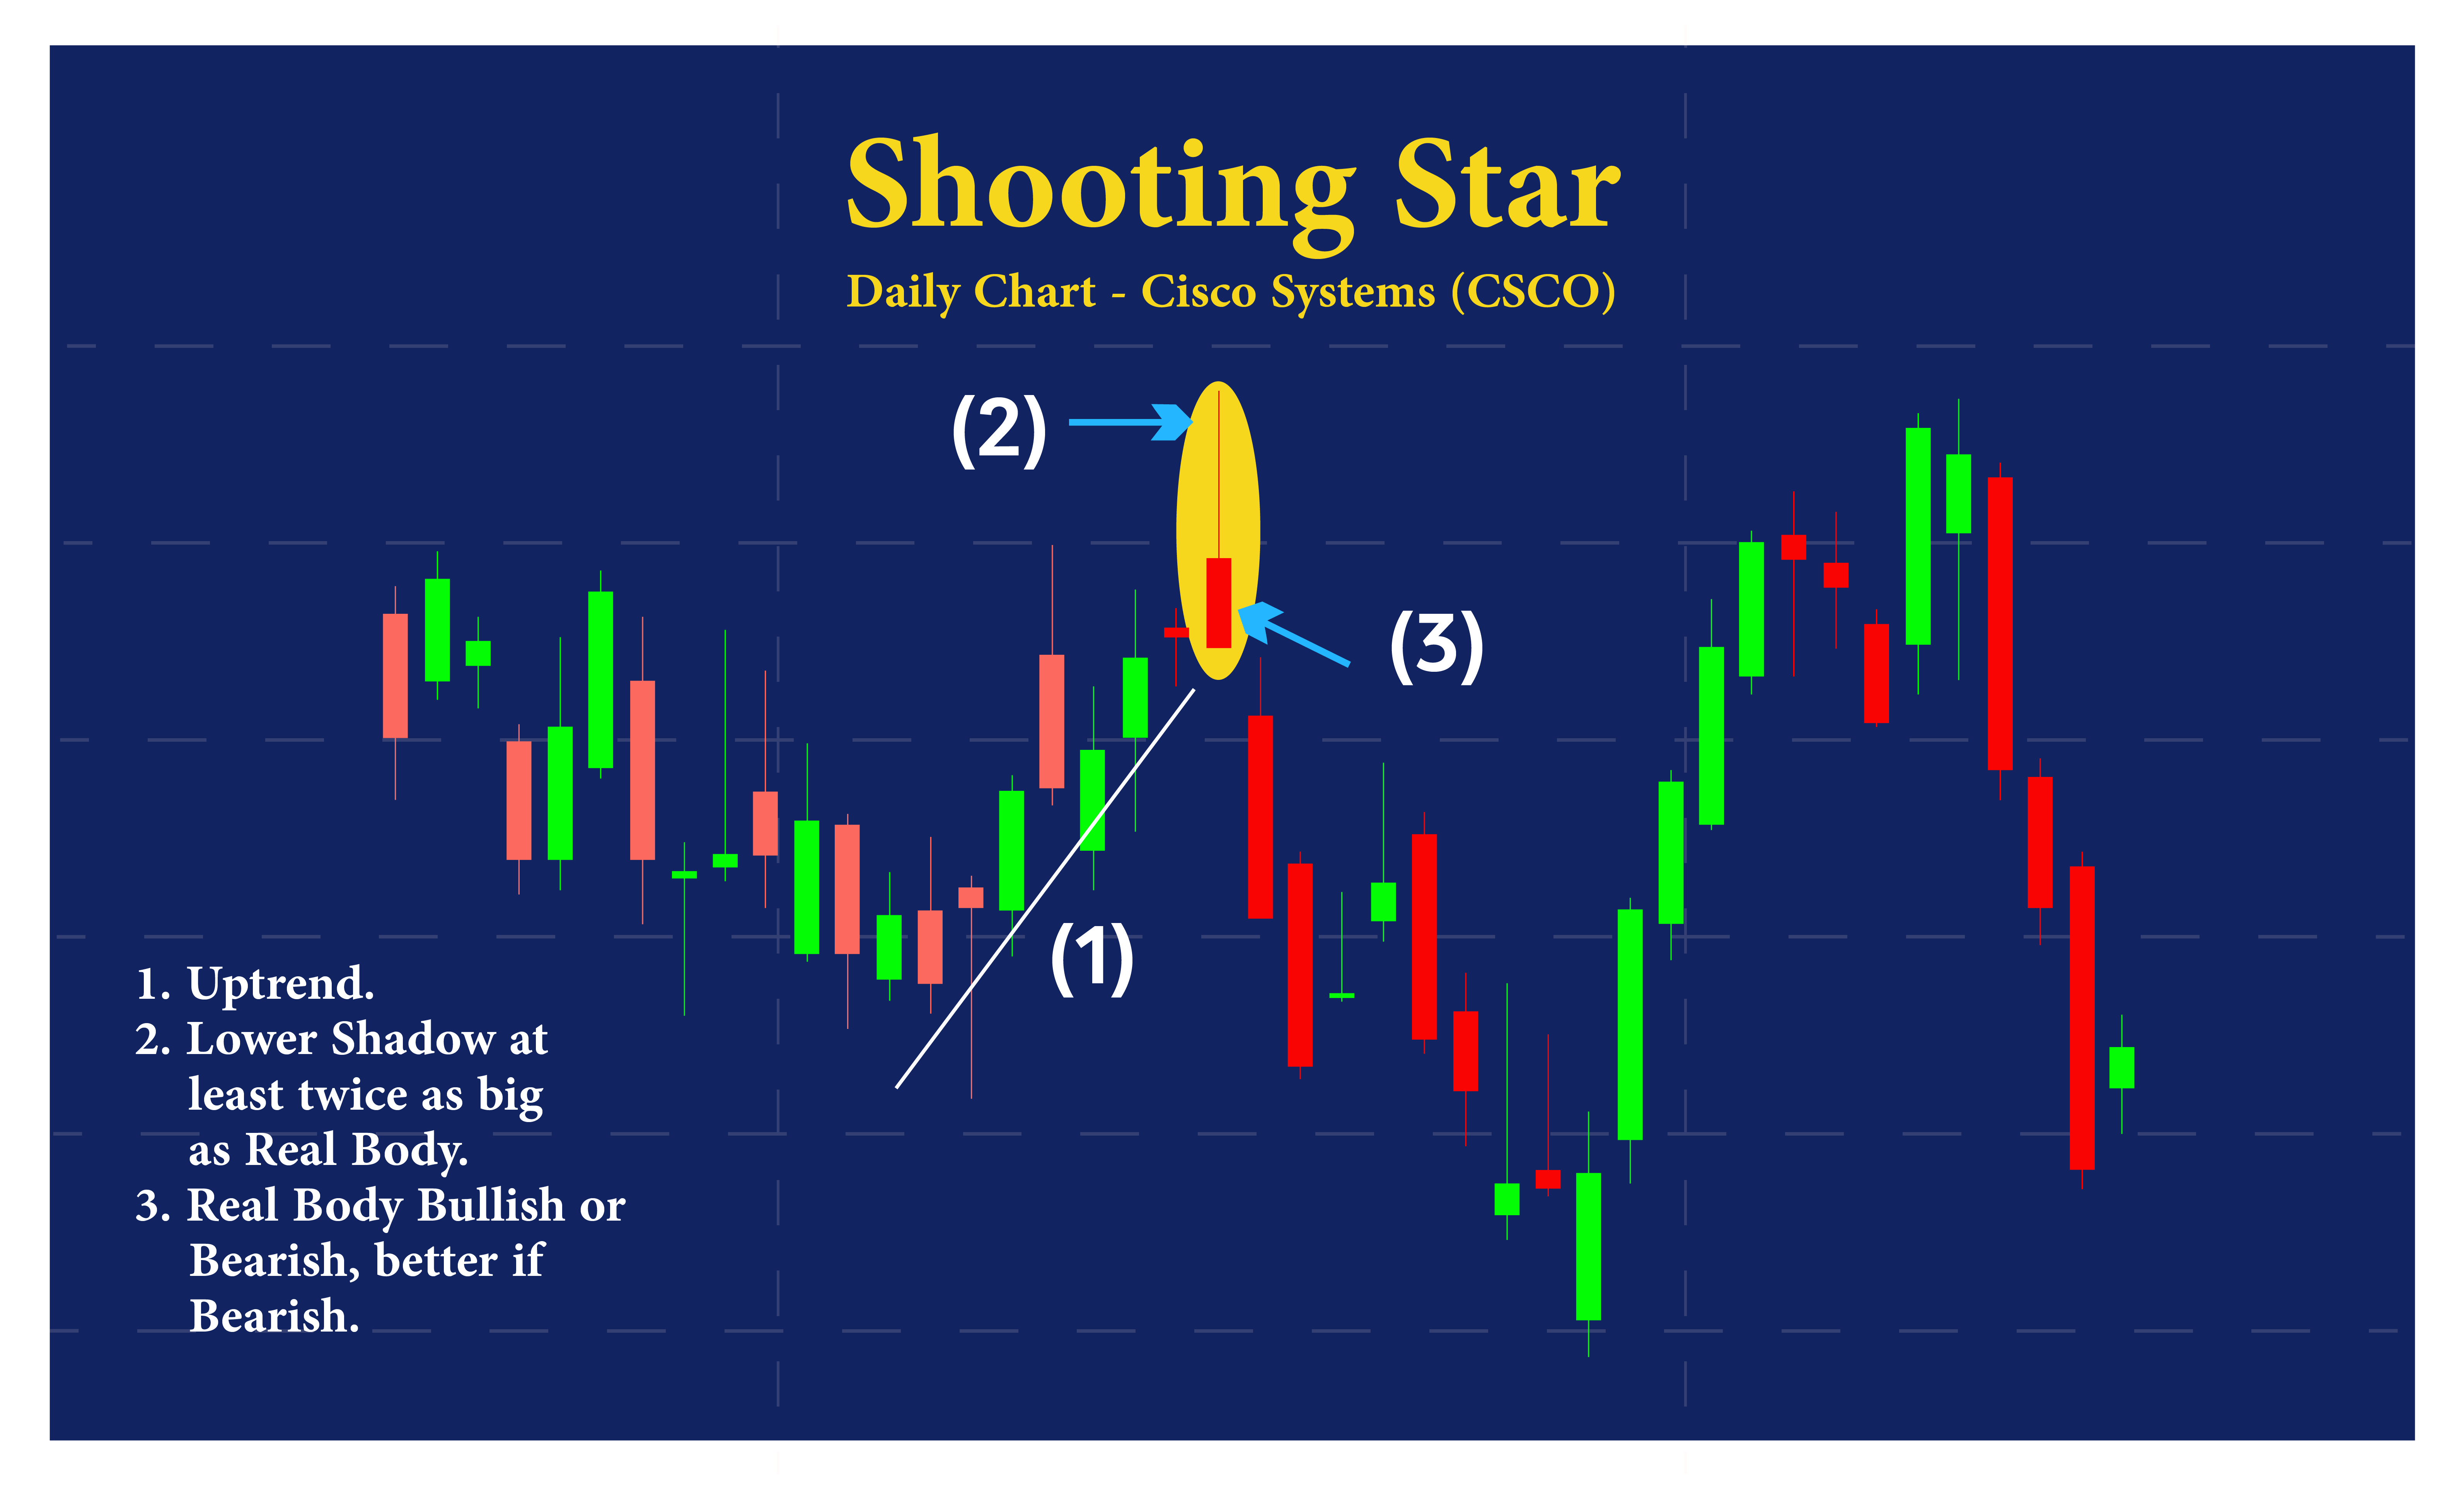
The Shooting Star: This pattern is characterized by a small body and a long upper wick. It indicates that buyers pushed prices higher during the session, but sellers ultimately took control and pushed prices back down.
Evening Star Candlestick Pattern
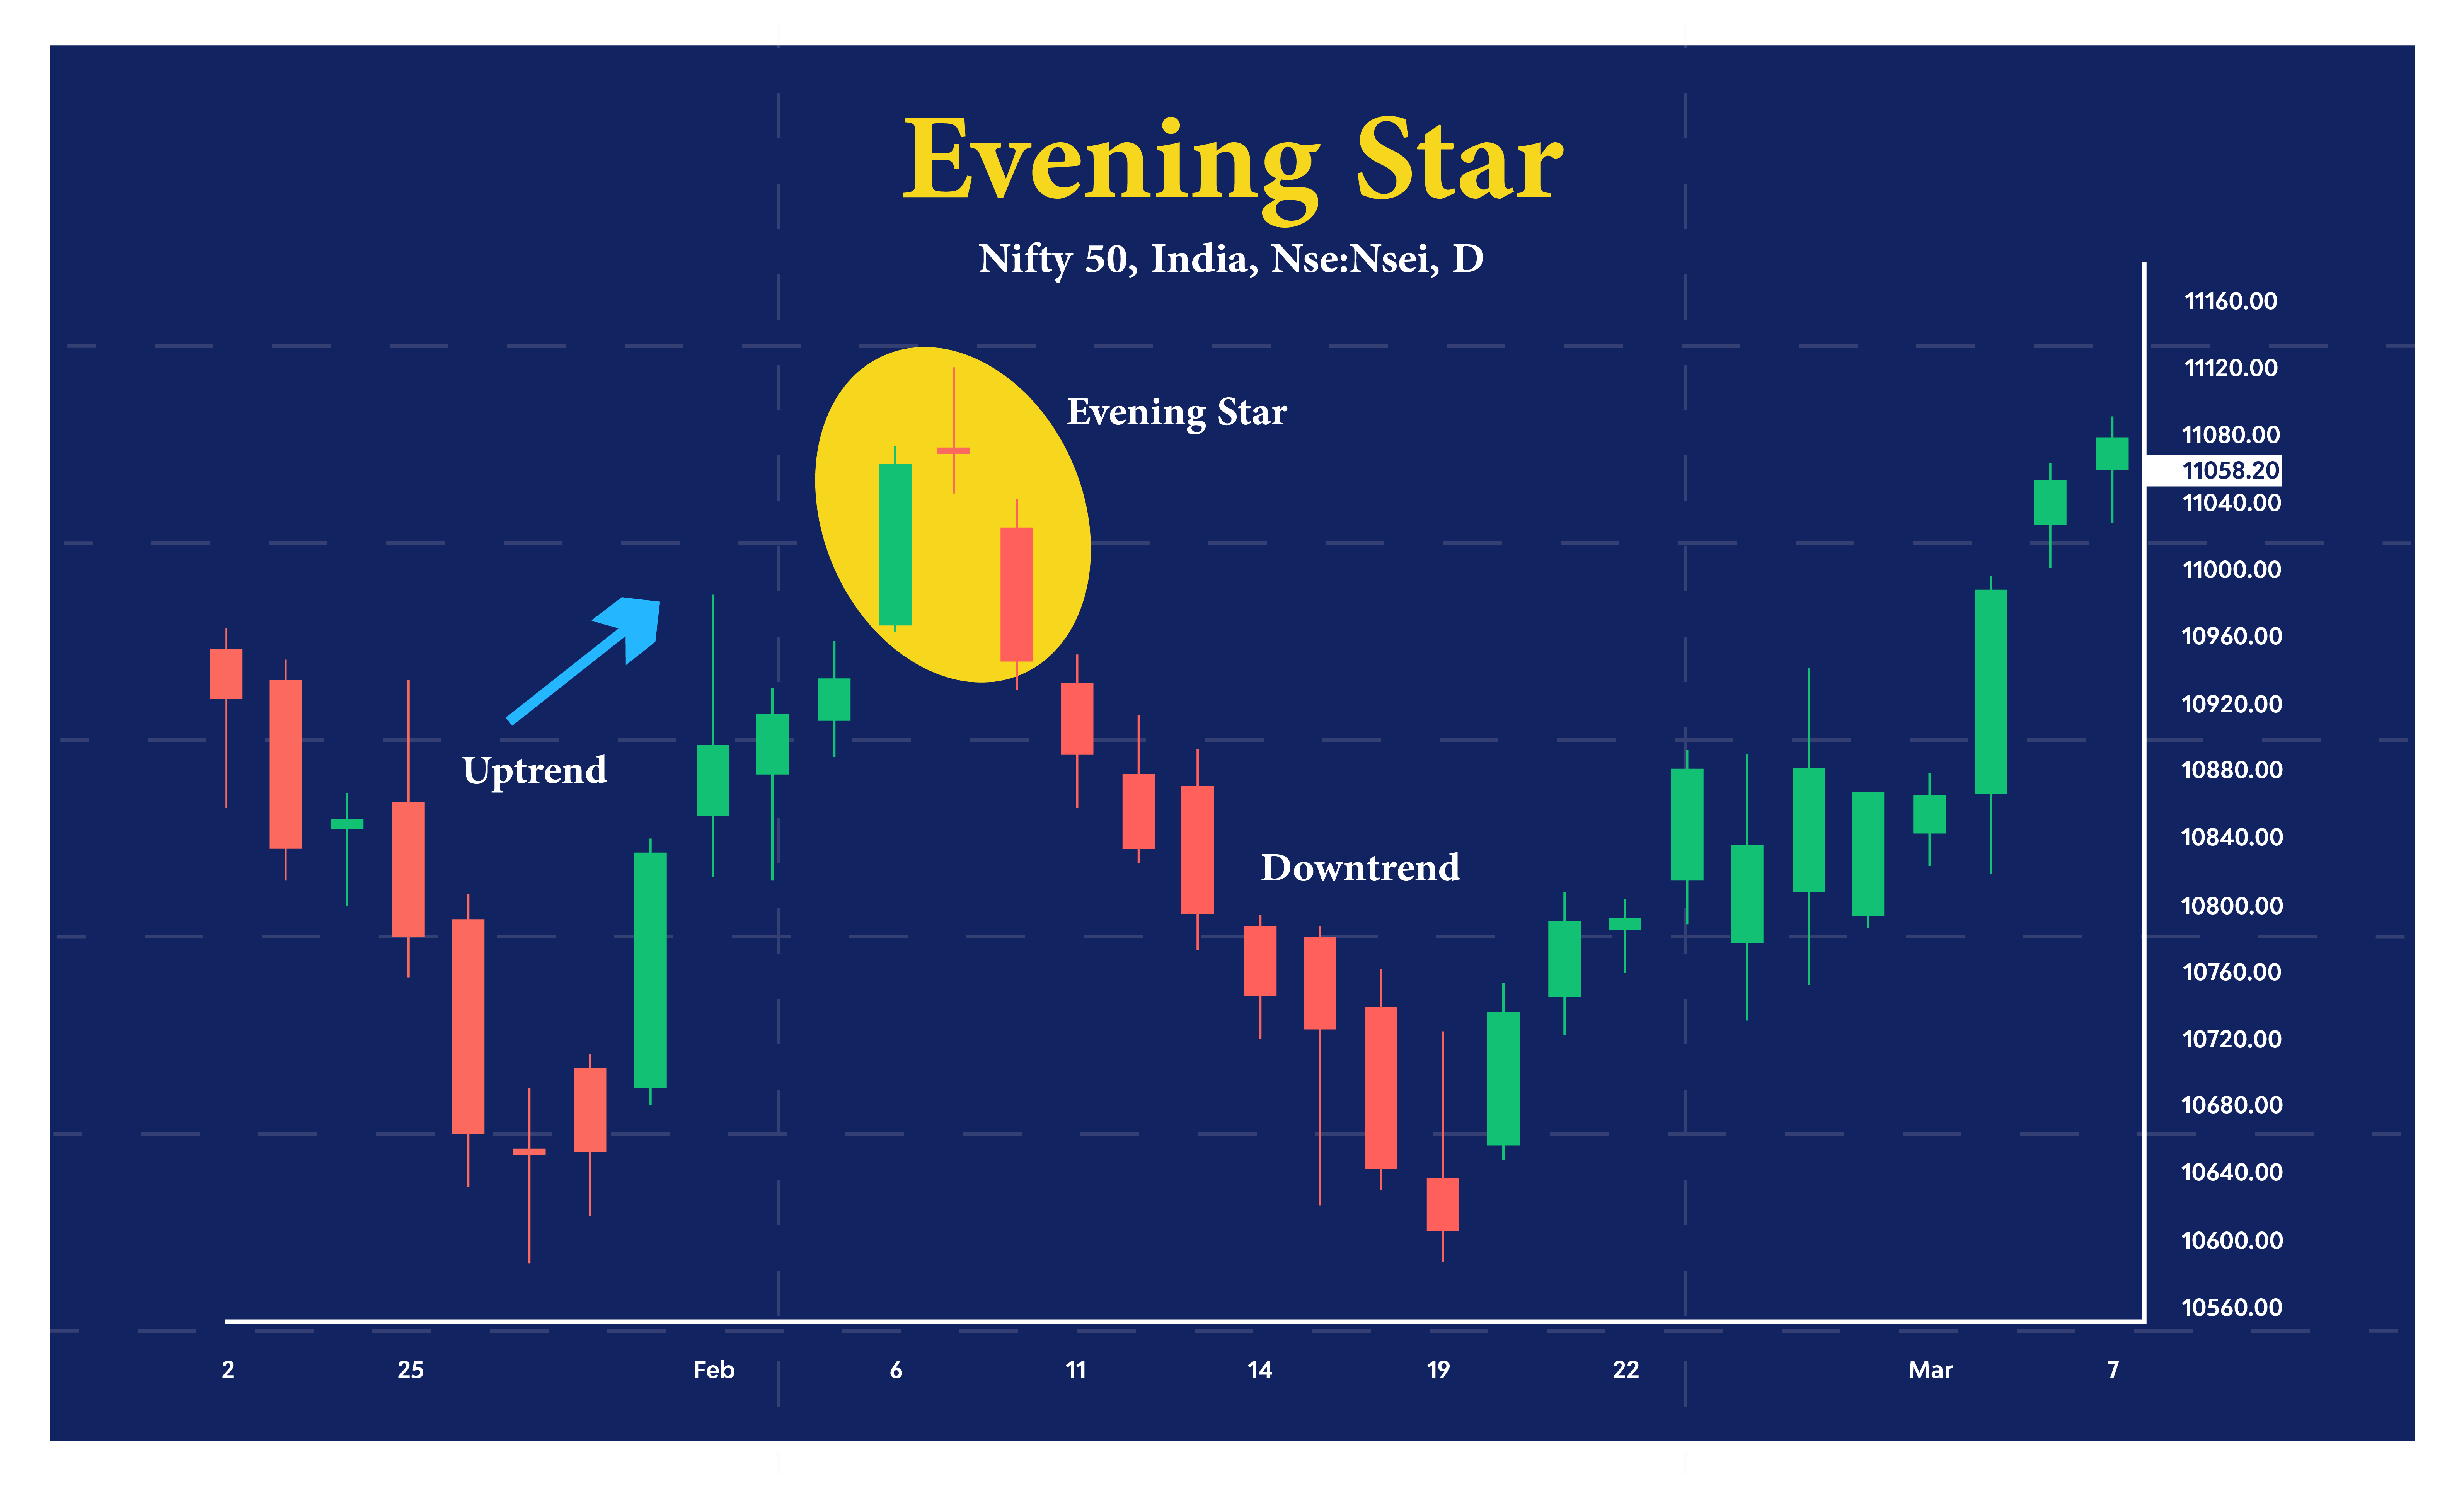
The Evening Star: This is a three-candle pattern that signals a shift from bullish to bearish sentiment. The first candlestick is a long green candlestick, followed by a small-bodied candlestick that gaps higher. The third candlestick is a long red candlestick that closes below the midpoint of the first candlestick.
Bearish Doji Candlestick Pattern
The Doji Pattern: This pattern is characterized by a small-bodied candlestick with a long upper and lower wick. It signals indecision in the market and suggests that neither buyers nor sellers have control over the price.
Understanding these candlestick patterns is an essential part of technical analysis, as they can provide valuable insights into market sentiment and potential price movements.
By recognizing these patterns and incorporating them into their trading strategies, traders can make more informed decisions and improve their chances of success.
Common Types of Candlestick Patterns
There are several common types of candlestick patterns that traders encounter. Each pattern has its unique significance and can be useful for informing trading strategies. Here are some key types of candlestick patterns:
|
Candlestick Pattern |
Description |
Implications |
| Hammer Candlestick |
A small candlestick with a long lower wick and a short upper wick, indicating a bullish reversal. |
Traders may interpret this pattern as a signal to buy. |
| Shooting Star Candlestick |
A small candlestick with a long upper wick and a short lower wick, indicating a bearish reversal. |
Traders may interpret this pattern as a signal to sell. |
|
Doji Candlestick |
A candlestick with a small body and long upper and lower wicks, indicating indecision in the market. |
Traders may interpret this pattern as a signal to wait for further confirmation before making a trading decision. |
|
Engulfing Candlestick Pattern |
A pattern where a bearish candlestick is followed by a bullish candlestick with a higher high and a lower low, indicating a bullish reversal. |
Traders may interpret this pattern as a signal to buy. |
|
Evening Star Candlestick |
A bearish reversal pattern where a long bullish candlestick is followed by a small doji, and then a long bearish candlestick. |
Traders may interpret this pattern as a signal to sell. |
|
Morning Star Candlestick |
A bullish reversal pattern where a long bearish candlestick is followed by a small doji, and then a long bullish candlestick. |
Traders may interpret this pattern as a signal to buy. |
It’s worth noting that while these patterns can be useful for informing trading strategies, they should not be relied on in isolation. It’s essential to consider other technical indicators and market trends before making trading decisions.
Incorporating Candlestick Patterns into Trading Strategies
While candlestick patterns can provide valuable insights into market conditions, incorporating them into a trading strategy requires careful consideration of multiple factors. Here are some techniques that traders use to make the most of candlestick patterns:
1. Identify the Primary Trend
Before analyzing individual candlestick patterns, it’s essential to identify the primary trend in the market. This can be done by analyzing longer-term charts and looking for patterns such as higher highs and higher lows in an uptrend or lower highs and lower lows in a downtrend.
Once the primary trend is identified, traders can use candlestick patterns to identify potential entry and exit points within that trend.
2. Combine Candlestick Patterns with Other Indicators
Candlestick patterns can be more powerful when used in conjunction with other technical indicators such as moving averages, oscillators, or trendlines. For example, a bullish candlestick pattern occurring at a support level identified through trendline analysis can provide a strong bullish signal.
3. Look for Confirmation Signals
While a single candlestick pattern may provide a signal for a potential price movement, it’s often prudent to wait for confirmation before taking action.
Confirmation signals can come from other candlestick patterns, technical indicators, or price action in subsequent periods.
For example, a bullish engulfing pattern followed by a strong price rally in the next few periods can provide confirmation that the bullish signal was accurate.
By combining candlestick patterns with other technical analysis tools and waiting for confirmation signals, traders can more effectively incorporate these patterns into their trading strategies.
However, it’s essential to remember that no single indicator is foolproof, and traders should always consider the broader market context before making any trading decisions.
Conclusion
Overall, candlestick patterns are an essential tool for traders looking to make informed decisions in the financial markets. By understanding the different types of patterns, traders can gain insights into market sentiment and potential price movements.
When incorporating candlestick patterns into trading strategies, it’s important to consider the context in which they occur and use confirmation signals to increase the probability of success. By doing so, traders can mitigate risk while maximizing potential profits.
Final thoughts
Whether you’re a seasoned trader or just starting out, learning how to read and interpret candlestick patterns can be a game-changer for your trading success.
By taking the time to study and understand these patterns, you can gain a deeper understanding of the markets and make more informed decisions.
Remember, trading is a dynamic and constantly evolving process, and candlestick patterns are just one tool in the trader’s arsenal.
However, by incorporating them into your trading strategy, you can increase your chances of success and achieve your financial goals.