Guide to Commodities Trading

Commodities trading has been around for centuries and has become an integral part of the global economy. However, it can seem intimidating and complex to those who are unfamiliar with the industry. That’s why we’ve put together the ultimate guide to commodities trading, to help demystify this fascinating sector.

In this guide, we’ll cover everything you need to know about commodities trading, including what commodities are, how they are traded, and the various markets and exchanges where they are bought and sold. We’ll also explore the different types of commodities, such as agricultural products, energy, and precious metals, and explain how they are valued and priced.

Whether you’re a seasoned trader or just starting out, this guide will provide you with the knowledge and insight you need to navigate the exciting and dynamic world of commodities trading. So, let’s get started and discover the ins and outs of this fascinating industry!

That’s why we’ve put together this ultimate guide to stock investing in the MENA region, packed with tips and strategies to help you make informed decisions and achieve your investment goals. Whether you’re a seasoned investor or just starting out, this guide will provide you with the knowledge and insights you need to succeed in this dynamic and exciting market.

At its core, commodities trading is the buying and selling of raw materials or primary goods. Commodities are physical goods that are traded on markets around the world, and their prices are determined by supply and demand factors. These goods can range from agricultural products like wheat, soybeans, and livestock, to energy commodities like oil and natural gas, to precious metals like gold and silver.

Commodities trading has been around for centuries, with some of the earliest recorded trades dating back to ancient civilizations like Egypt and Greece. Today, commodities trading is a global industry, with markets and exchanges located in countries around the world. These markets provide a platform for buyers and sellers to trade commodities, and they are regulated by government agencies and industry organizations to ensure fairness and safety.

The commodities trading process involves a number of steps, including market analysis, price discovery, and risk management. Traders use a variety of tools and techniques to analyze market trends and make informed trading decisions, including technical analysis, fundamental analysis, and market sentiment analysis. Once a trader has identified a potential trade, they will use a broker or trading platform to execute the trade and manage the associated risks.

There are many different types of commodities that are traded on markets around the world. These commodities can be broadly categorized into three main groups: agricultural products, energy commodities, and precious metals.

products are commodities that are grown or produced on farms, such as wheat, corn, soybeans, and livestock. These commodities are traded on agricultural commodity exchanges, and their prices are influenced by factors such as weather conditions, harvest yields, and global demand.

commodities are commodities that are used to power the world’s economies, such as oil, natural gas, and coal. These commodities are traded on energy commodity exchanges and their prices are influenced by factors such as geopolitical tensions, global demand, and supply disruptions.

are commodities that are valued for their rarity and beauty, such as gold, silver, and platinum. These commodities are traded on precious metals exchanges, and their prices are influenced by factors such as global economic conditions, inflation, and political instability.

Commodity prices are influenced by a wide range of factors, including supply and demand dynamics, market sentiment, geopolitical events, and weather conditions. Understanding these factors is essential for successful commodities trading, as they can have a significant impact on the profitability of a trade.

Supply and demand dynamics are one of the primary factors that influence commodity prices. When demand for a commodity is high and supply is low, prices will generally rise. Conversely, when supply is high and demand is low, prices will generally fall. Traders use a variety of tools and techniques to analyze supply and demand trends, including technical analysis, fundamental analysis, and market sentiment analysis.

Market sentiment is another important factor that can influence commodity prices. When traders are optimistic about the future of a particular commodity, prices will generally rise. Conversely, when traders are pessimistic about the future of a commodity, prices will generally fall. Traders use a variety of tools and techniques to analyze market sentiment, including sentiment indicators, news feeds, and social media analysis.

Geopolitical events can also have a significant impact on commodity prices. When there is political instability or conflict in a region that produces a particular commodity, prices will generally rise. Conversely, when political tensions ease, prices will generally fall. Traders use a variety of tools and techniques to monitor geopolitical events, including news feeds, social media analysis, and geopolitical risk analysis.

Weather conditions are another important factor that can influence commodity prices. When weather conditions are favorable for crop production, prices for agricultural commodities will generally fall. Conversely, when weather conditions are unfavorable, prices will generally rise. Traders use a variety of tools and techniques to monitor weather conditions, including satellite imagery, weather forecasts, and crop progress reports.


Commodities trading has a long and fascinating history, dating back to ancient civilizations like Egypt and Greece. In these early societies, commodities like grain and olive oil were traded for other goods and services, and the trading process was often conducted through barter.

Over time, commodities trading evolved into a more formalized system, with the establishment of commodity markets and exchanges in cities around the world. These markets provided a platform for buyers and sellers to trade commodities, and they were often located in strategic locations near transportation hubs like ports and railroads.

Today, commodities trading is a global industry, with markets and exchanges located in countries around the world. These markets provide a platform for buyers and sellers to trade commodities, and they are regulated by government agencies and industry organizations to ensure fairness and safety.

Commodities trading offers a number of benefits to traders, including the potential for high returns and portfolio diversification. By investing in commodities, traders can take advantage of price fluctuations and potentially earn significant profits.

However, commodities trading also carries a number of risks, including price volatility, market manipulation, and geopolitical events. Traders must be prepared to manage these risks through effective risk management techniques, such as stop-loss orders and position sizing.

There are many different strategies that traders use to trade commodities, including trend following, mean reversion, and breakout trading. Trend following involves identifying and following trends in commodity prices, while mean reversion involves trading against trends in order to take advantage of price reversals. Breakout trading involves identifying key levels of support and resistance and trading based on price movements around these levels.

Traders can also use technical analysis and fundamental analysis to inform their trading decisions. Technical analysis involves analyzing price charts and identifying patterns and trends, while fundamental analysis involves analyzing economic and financial data to identify potential trading opportunities.

Choosing the right commodities trading broker is essential for success in the commodities markets. Traders should look for brokers that offer competitive pricing, a wide range of trading tools and resources, and excellent customer support.

Traders should also consider the regulatory environment in which a broker operates, as well as the broker’s reputation in the industry. Traders can research brokers online, read reviews and ratings from other traders, and compare pricing and features before making a decision.

Commodities trading platforms are software applications that allow traders to execute trades and manage their portfolios. These platforms offer a wide range of features and tools, including real-time market data, charting and analysis tools, and risk management features.

Traders should look for commodities trading platforms that offer a user-friendly interface, a wide range of trading tools and resources, and excellent customer support. They should also consider the cost of using the platform, including any fees or commissions charged by the platform provider.

Commodities trading is a highly regulated industry, with rules and regulations governing everything from market access to trading practices. Traders should be aware of the regulatory environment in which they operate, and ensure that they are in compliance with all applicable laws and regulations.

In the United States, the primary regulator of commodities trading is the Commodity Futures Trading Commission (CFTC), which oversees the commodities markets and enforces regulations designed to protect traders and ensure market integrity. Traders should also be aware of the regulations governing commodities trading in other countries, particularly if they are trading on international markets.

There are many resources and tools available to traders who are interested in commodities trading. These include market news and analysis, trading platforms and software, and educational resources and courses.

Traders can access market news and analysis through a variety of sources, including financial news websites, social media, and market research reports. They can also use trading platforms and software to execute trades and manage their portfolios, and they can take advantage of educational resources and courses to improve their trading skills and knowledge.

Commodities trading is a fascinating and dynamic industry that offers a wealth of opportunities to traders who are willing to learn and take risks. By understanding the basics of commodities trading, the various types of commodities, and the factors that influence commodity prices, traders can make informed trading decisions and potentially earn significant profits.

However, traders must also be aware of the risks associated with commodities trading, and take steps to manage these risks through effective risk management techniques. By choosing the right commodities trading broker and platform, and staying up-to-date with the latest news and analysis, traders can successfully navigate the exciting and ever-changing world of commodities trading.


What is Relative Strength Index RSI?

As a trader, it’s important to have access to various tools that can help you make informed decisions. One such tool is the relative strength index or RSI, which is a technical analysis indicator used to measure the strength of a security or market trend. By using RSI, traders can identify overbought and oversold conditions in the market, evaluate momentum and strength of price movements, and ultimately make better trading decisions.

In this section, we’ll take a closer look at RSI and what it entails. We’ll explain how RSI is calculated and provide insight into its significance in trading. Understanding RSI is crucial to using it effectively, so let’s get started.

Key takeaways:

  • RSI is a technical analysis indicator used to measure the strength of a security or market trend.
  • RSI helps traders identify overbought and oversold conditions in the market, as well as evaluate momentum and strength of price movements.
  • Understanding RSI is crucial to using it effectively.

Understanding RSI Calculation

The Relative Strength Index, commonly known as RSI, is a popular technical indicator used in trading. It measures the speed and change of price movements, indicating whether a particular asset is overbought or oversold by comparing the magnitude of its recent gains to its recent losses.

RSI is calculated using the following formula:

RSI = 100 – (100 / (1 + RS))
Where:
RS = Average gain of up periods / Average loss of down periods

The RSI value ranges from 0 to 100. A reading above 70 indicates an overbought condition, while a reading below 30 indicates an oversold condition. Traders often use RSI in conjunction with other indicators to confirm trading signals and make informed decisions.

For example, if a trader sees an RSI reading above 70 and a bearish signal from another indicator, it may indicate an impending trend reversal and provide a sell signal. However, if RSI is above 70 and there are bullish signals from other indicators, it may indicate a continuation of the current trend and provide a buying opportunity.

Interpreting RSI Values

Interpreting RSI values can help traders determine the strength and momentum of price movements. If the RSI value is higher than the previous reading, it indicates that buying pressure is increasing. Conversely, if the RSI value is lower than the previous reading, it indicates that selling pressure is increasing.

Traders may also use RSI divergence to confirm potential trend reversals. For instance, if an asset’s price is reaching new highs while the RSI is not, it may indicate that the uptrend is running out of steam and provide a sell signal.

In summary, understanding RSI calculation and interpretation is crucial for traders who wish to use this technical indicator in their trading decisions. The next section will explore how RSI can be used as a market assessment tool to further aid traders in analyzing price movements.

RSI as a Market Assessment Tool

The Relative Strength Index (RSI) is a valuable tool that traders can use to assess the market conditions. It helps to identify both oversold and overbought conditions in the market, as well as measure the strength and momentum of price movements. The RSI is calculated by comparing the average gains and losses over a specific period.

When the RSI is above 70, it suggests that the market is overbought and there is a high probability of a reversal. Conversely, when the RSI is below 30, it suggests that the market is oversold and a potential reversal is likely.

The RSI can also be used to identify divergences between the RSI and the price. A bullish divergence occurs when the price is making lower lows, but the RSI is making higher lows. A bearish divergence occurs when the price is making higher highs, but the RSI is making lower highs.

RSI Symptoms and Causes

It is important to understand the symptoms and causes of RSI to make informed decisions about trading. Some common symptoms of RSI include pain, stiffness, and numbness in the hands, wrists, and arms. The causes of RSI can include repetitive motions, poor posture, and lack of rest or breaks.

Traders need to be aware of these symptoms and take proactive measures to prevent and manage RSI. This can include adjusting their trading workstation to promote better ergonomics, taking frequent breaks, and practicing exercises to relieve tension in the hands and arms.

Ultimately, using the RSI as a market assessment tool can help traders make better-informed decisions and avoid potential losses. By understanding the symptoms and causes of RSI, traders can take steps to prevent and manage this painful condition and improve their overall trading performance.

RSI for Informed Decision Making

Using RSI in trading can provide valuable insights and help traders make informed decisions. However, it is important to take steps to prevent RSI and find relief if symptoms are already present.

Several strategies and techniques can help prevent RSI, such as taking frequent breaks, using ergonomic equipment, and maintaining proper posture. Traders can also incorporate physical exercises and stretches into their routine to reduce the risk of developing RSI.

If symptoms of RSI are already present, there are several remedies that traders can try. These include applying heat or cold to affected areas, massaging the affected muscles, and taking anti-inflammatory medication.

It is crucial for traders to prioritize their health and well-being in order to perform at their best. By incorporating RSI prevention and relief techniques into their routine, traders can reduce the risk of injury and improve their overall performance.

RSI Exercises and Remedies

Repetitive Strain Injury (RSI) is a common ailment among traders who spend a considerable amount of time on their computers.

If you’re experiencing RSI symptoms or want to prevent them, here are some exercises and remedies you can try:

Exercises

  • Finger stretches: Hold your hand in front of you with fingers straight and close together. Slowly spread your fingers apart and hold for 5 seconds. Repeat 10 times on each hand.
  • Wrist rotations: Hold your arm out with your palm facing down. Slowly rotate your wrist in a circular motion, keeping your arm still. Repeat 10 times on each hand.
  • Neck stretches: Tilt your head to the left and hold for 10 seconds. Repeat on the right side. Then, tilt your head forward and hold for 10 seconds. Repeat by tilting your head back.

Remedies

Aside from exercises, there are several remedies you can try to relieve RSI symptoms:

  • Take breaks: Make sure to take frequent breaks to stretch, move around, or simply rest your eyes.
  • Use ergonomic equipment: Invest in an ergonomic mouse, keyboard, and chair to reduce strain on your body.
  • Apply heat or cold: Use a heating pad or cold pack on the affected area to reduce inflammation and pain.

By incorporating these exercises and remedies into your routine, you can manage and prevent RSI symptoms while improving your overall trading performance.

Conclusion

Overall, the relative strength index (RSI) is a valuable tool for traders to assess market conditions and make informed decisions. By understanding the calculation method of the RSI, traders can interpret its technical analysis to identify overbought and oversold conditions in the market, as well as measure the strength and momentum of price movements.

Although RSI can be a helpful tool, it is important to take steps to prevent or manage RSI symptoms. This includes implementing ergonomic practices and incorporating RSI exercises and remedies into daily routines. By prioritizing health and wellness, traders can improve their overall performance and reduce the risk of RSI.

By incorporating RSI into their trading strategies, traders can gain a deeper understanding of market conditions and make more informed decisions. Remember to stay mindful of RSI symptoms and prioritize self-care to maintain a healthy and successful trading career.

FAQ

Q: What is the relative strength index (RSI)?

A: The relative strength index (RSI) is a valuable tool for traders to assess the strength and momentum of price movements in a market. It helps identify overbought and oversold conditions and is widely used for technical analysis.

Q: How is RSI calculated?

A: RSI is calculated using a formula that takes into account the average gain and average loss of an asset’s price over a specified period of time. The resulting RSI value ranges from 0 to 100, with values above 70 indicating overbought conditions and values below 30 indicating oversold conditions.

Q: Why is RSI important in trading?

A: RSI is important in trading as it provides traders with insights into market conditions and potential price reversals. By understanding the RSI, traders can make informed decisions and implement strategies to maximize their trading success.

Q: How can RSI be used as a market assessment tool?

A: RSI can be used as a market assessment tool to identify overbought and oversold conditions. It helps traders gauge the strength and momentum of price movements, allowing them to anticipate potential market reversals and make informed trading decisions.

Q: How can RSI help with decision making?

A: RSI can help traders make informed decisions by providing insights into market conditions and potential price reversals. By understanding the RSI, traders can implement appropriate strategies, prevent RSI symptoms, and improve overall trading performance.

Q: What exercises and remedies can help with RSI?

A: There are various exercises and remedies that can help alleviate RSI symptoms. Physical exercises, lifestyle changes, and ergonomic improvements can all contribute to managing and improving RSI. It’s important to consult with a healthcare professional for personalized advice.

How to Use a Moving Averages to Buy Stocks

If you are new to stock trading, you might have heard of the term “moving averages” A moving average is a commonly used technical analysis tool that helps traders identify trends and potential buy/sell opportunities.

In this article, we will explain what moving averages are, how to use them to buy stocks, and advanced techniques to help you take your trading to the next level.

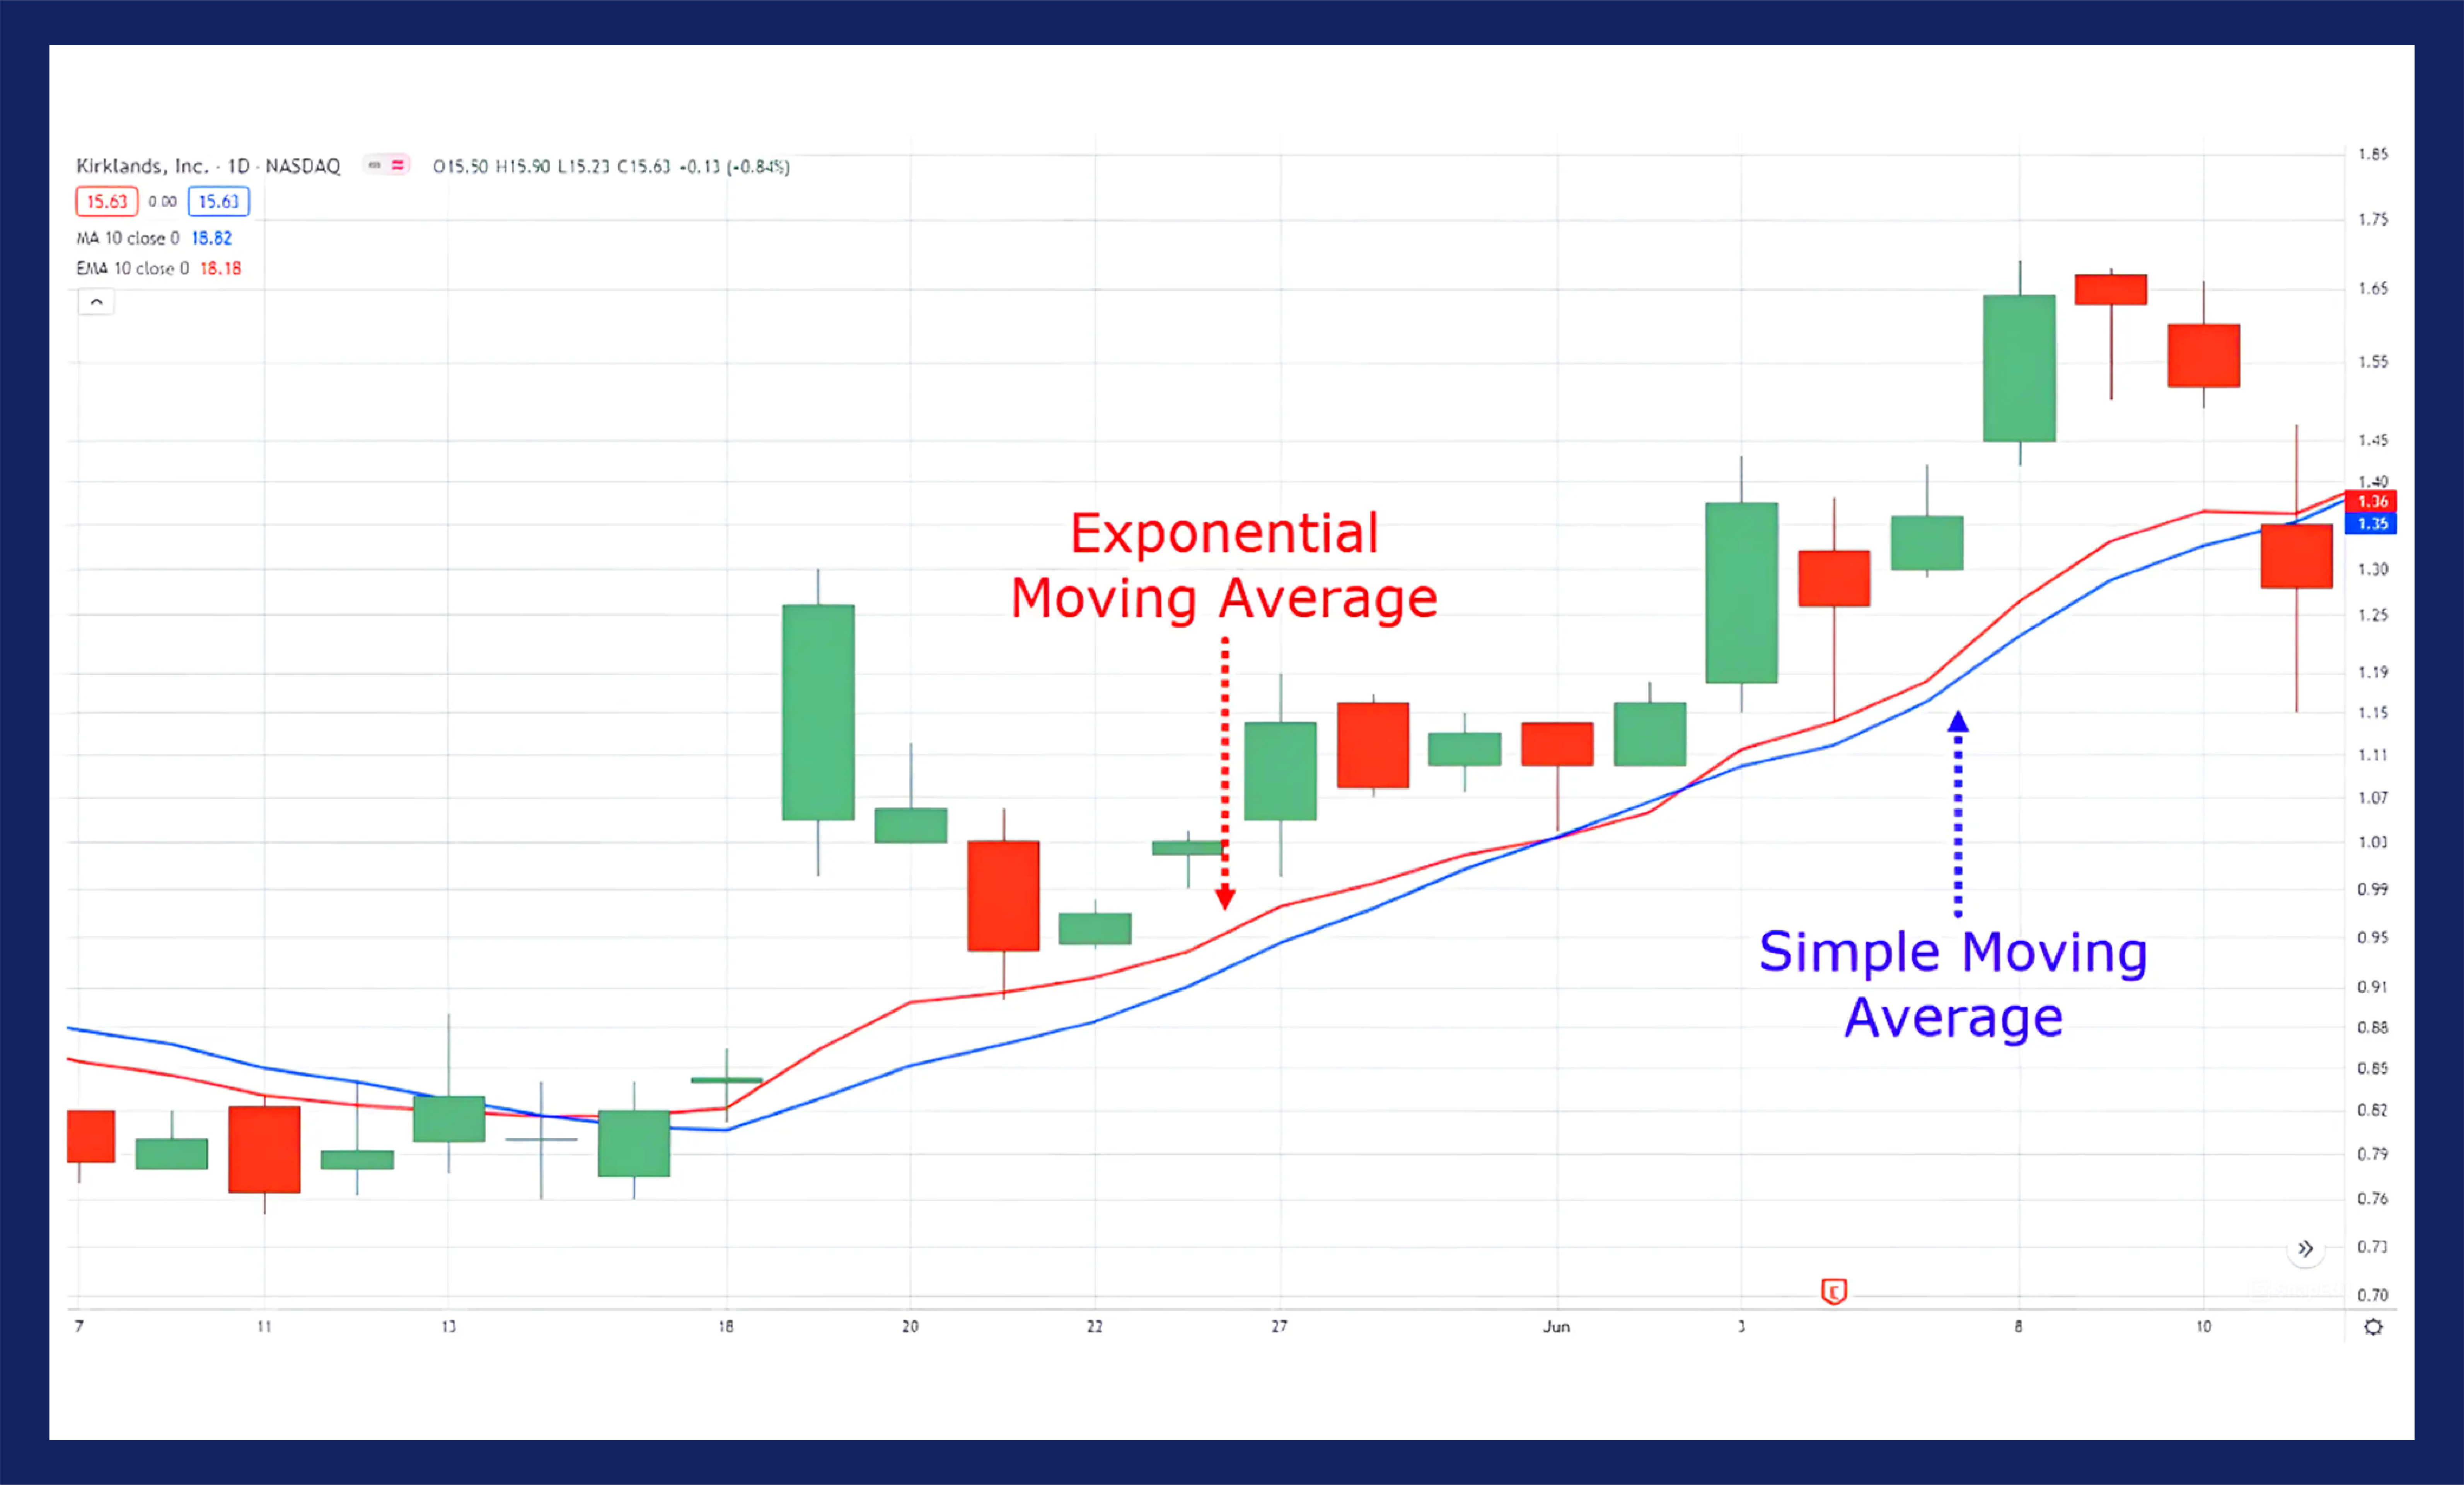
Before we get started, there are two types of moving averages: simple moving averages (SMA) and exponential moving averages (EMA). SMAs give equal weight to each data point, while EMAs give more weight to recent data points. The choice between SMAs and EMAs depends on your trading strategy and style.
Key Takeaways:

  • Moving averages are commonly used technical analysis tools for identifying trends and potential buy/sell opportunities.
  • There are two types of moving averages: simple moving averages (SMA) and exponential moving averages (EMA).
  • The choice between SMAs and EMAs depends on your trading strategy and style.

Understanding Moving Average Crossovers

If you’ve started trading stocks, you probably already stumbled upon the concept of moving averages. A moving average is a trend-following indicator that smooths out fluctuations in stock prices, showing an average price over a certain period of time. However, it’s not enough to simply know what a moving average is, you need to understand what a moving average crossover is and how to use it in your trading strategy.

What is a Moving Average Crossover?

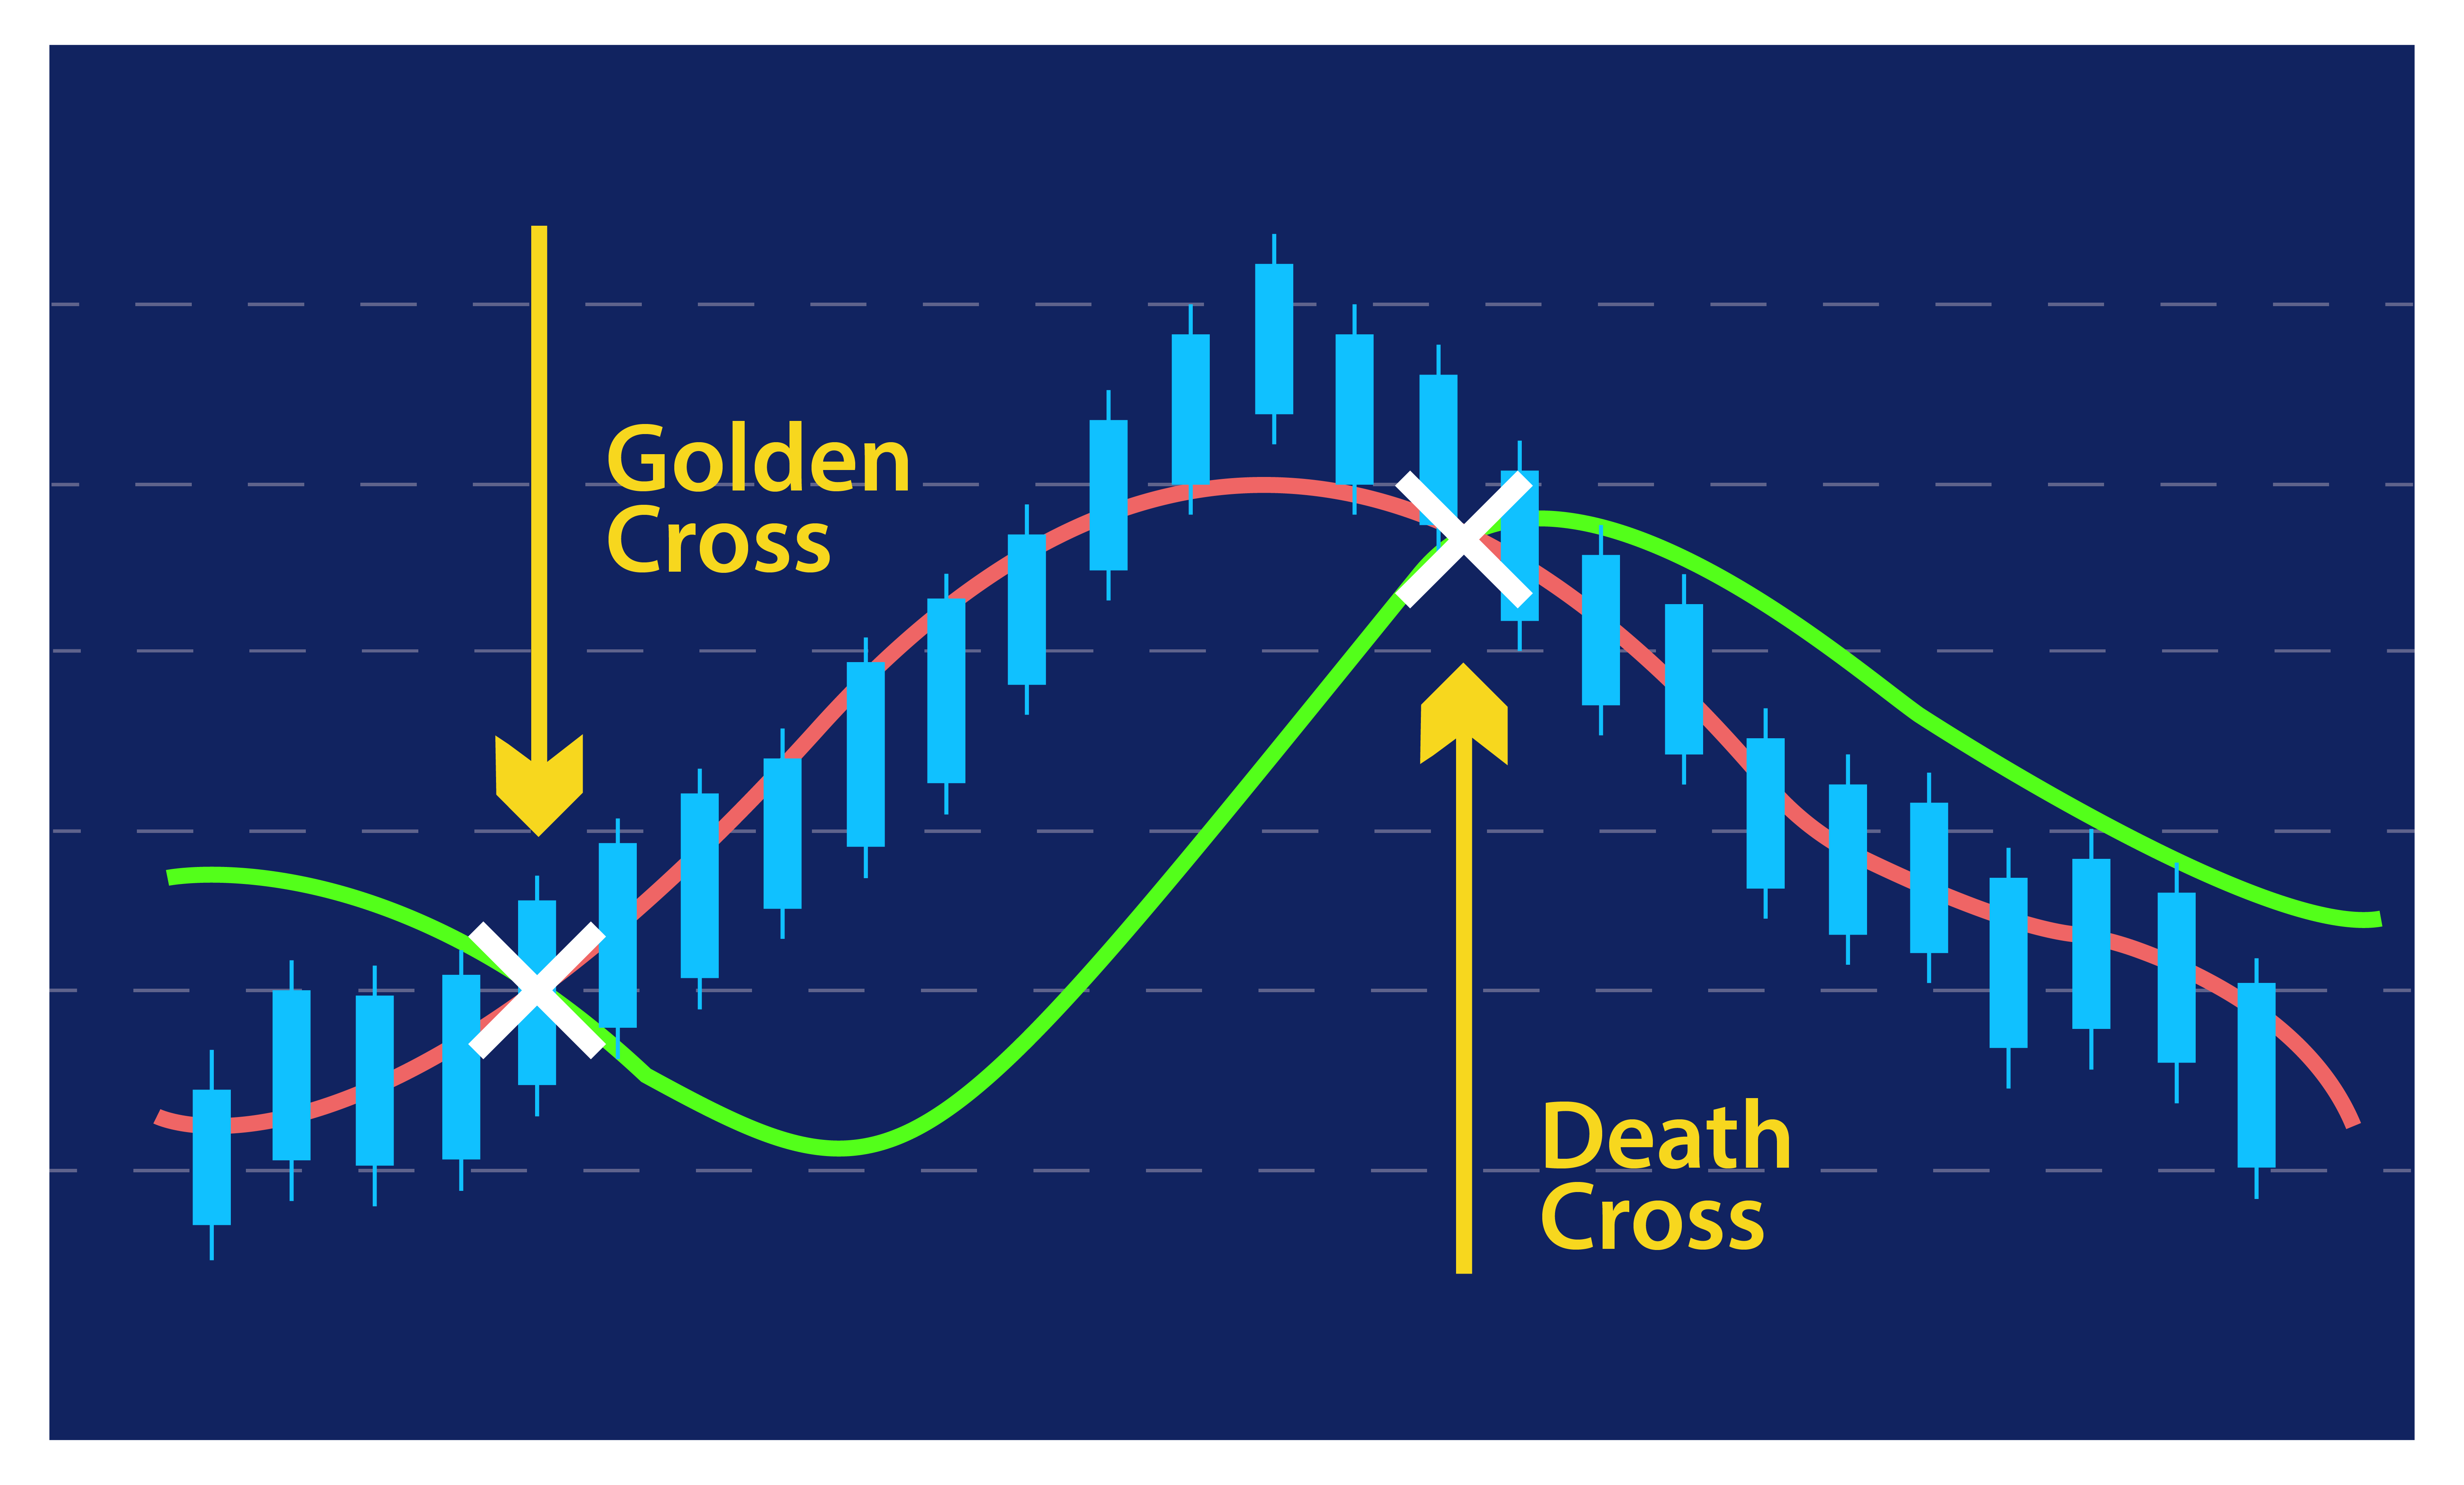
A moving average crossover occurs when two moving averages with different periods intersect. Specifically, a shorter period moving average (e.g. 20-day moving average) will intersect a longer period moving average (e.g. 50-day moving average) at some point. This intersection represents a change in trend direction and can signal a buy or sell signal for traders.

There are two types of moving average crossovers:

  • Golden Cross: This occurs when a shorter period moving average (e.g. 50-day moving average) crosses above a longer period moving average (e.g. 200-day moving average), indicating a bullish trend.
  • Death Cross: This occurs when a shorter period moving average (e.g. 50-day moving average) crosses below a longer period moving average (e.g. 200-day moving average), indicating a bearish trend.

The moving average crossover is one of the most popular trading strategies for technical analysts. Its simplicity and clarity make it an effective tool for identifying trends and making trading decisions.
How to Use Moving Average Crossovers in Your Trading Strategy

When using moving average crossovers in your trading strategy, it’s important to consider the following:

  • Timeframe: Choose a timeframe that suits your trading style and goals. Short-term traders may use a shorter period moving average (e.g. 20-day moving average) while long-term traders may use a longer period moving average (e.g. 200-day moving average).
  • Confirmation: Use other indicators or technical analysis tools to confirm the buy or sell signal from the moving average crossover. Don’t rely solely on the crossover signal.
  • Risk management: Set stop-loss orders to limit losses in case the trade goes against you. Also, consider the risk-to-reward ratio before entering a trade.

In conclusion, understanding moving average crossovers is essential for traders who want to use technical analysis to make informed trading decisions.

By combining moving averages with other technical analysis tools, traders can increase their chances of success.

Calculating and Using Moving Averages

Now that you understand the basics of moving averages and how they can be used in conjunction with your stock trading strategy, let’s explore the specifics of how to calculate and use moving averages.

The Moving Average Formula

There are two main types of moving averages: the simple moving average (SMA) and the exponential moving average (EMA).

The SMA calculates the average price of a stock over a specific time period, while the EMA places more weight on recent prices. The formula for calculating the SMA is:

PeriodClosing PricesSMA
Day 1100
Day 2110
Day 3120
Day 4130
Day 5125
Day 6135
Day 7140
Day 8145
Day 9150
Day 10155

For example, let’s say you want to calculate the SMA for a stock over a 10-day period. The closing prices for each day are listed in the table above. To calculate the average price for the first day, you would add the closing prices for days 1 through 10 and divide by 10:

(100 + 110 + 120 + 130 + 125 + 135 + 140 + 145 + 150 + 155) / 10 = 130

So the SMA for day 10 would be 130.

Using Moving Averages for Trading

Once you have calculated the SMA or EMA for a stock, you can use it in a number of ways to inform your trading strategy. For example:

  • Buy signals: If the price of a stock crosses above its moving average, it may indicate a buy signal. This is known as a golden cross.
  • Sell signals: If the price of a stock crosses below its moving average, it may indicate a sell signal. This is known as a death cross.
  • Trend identification: You can use moving averages to identify the direction of a stock’s trend. A stock trading above its moving average is considered to be in an uptrend, while a stock trading below its moving average is considered to be in a downtrend.

It’s important to note that no trading strategy is foolproof and that using moving averages alone is not enough to guarantee success in the stock market. It’s always a good idea to do your own research and consult with a financial advisor before making any trading decisions.

Advanced Techniques with Moving Averages

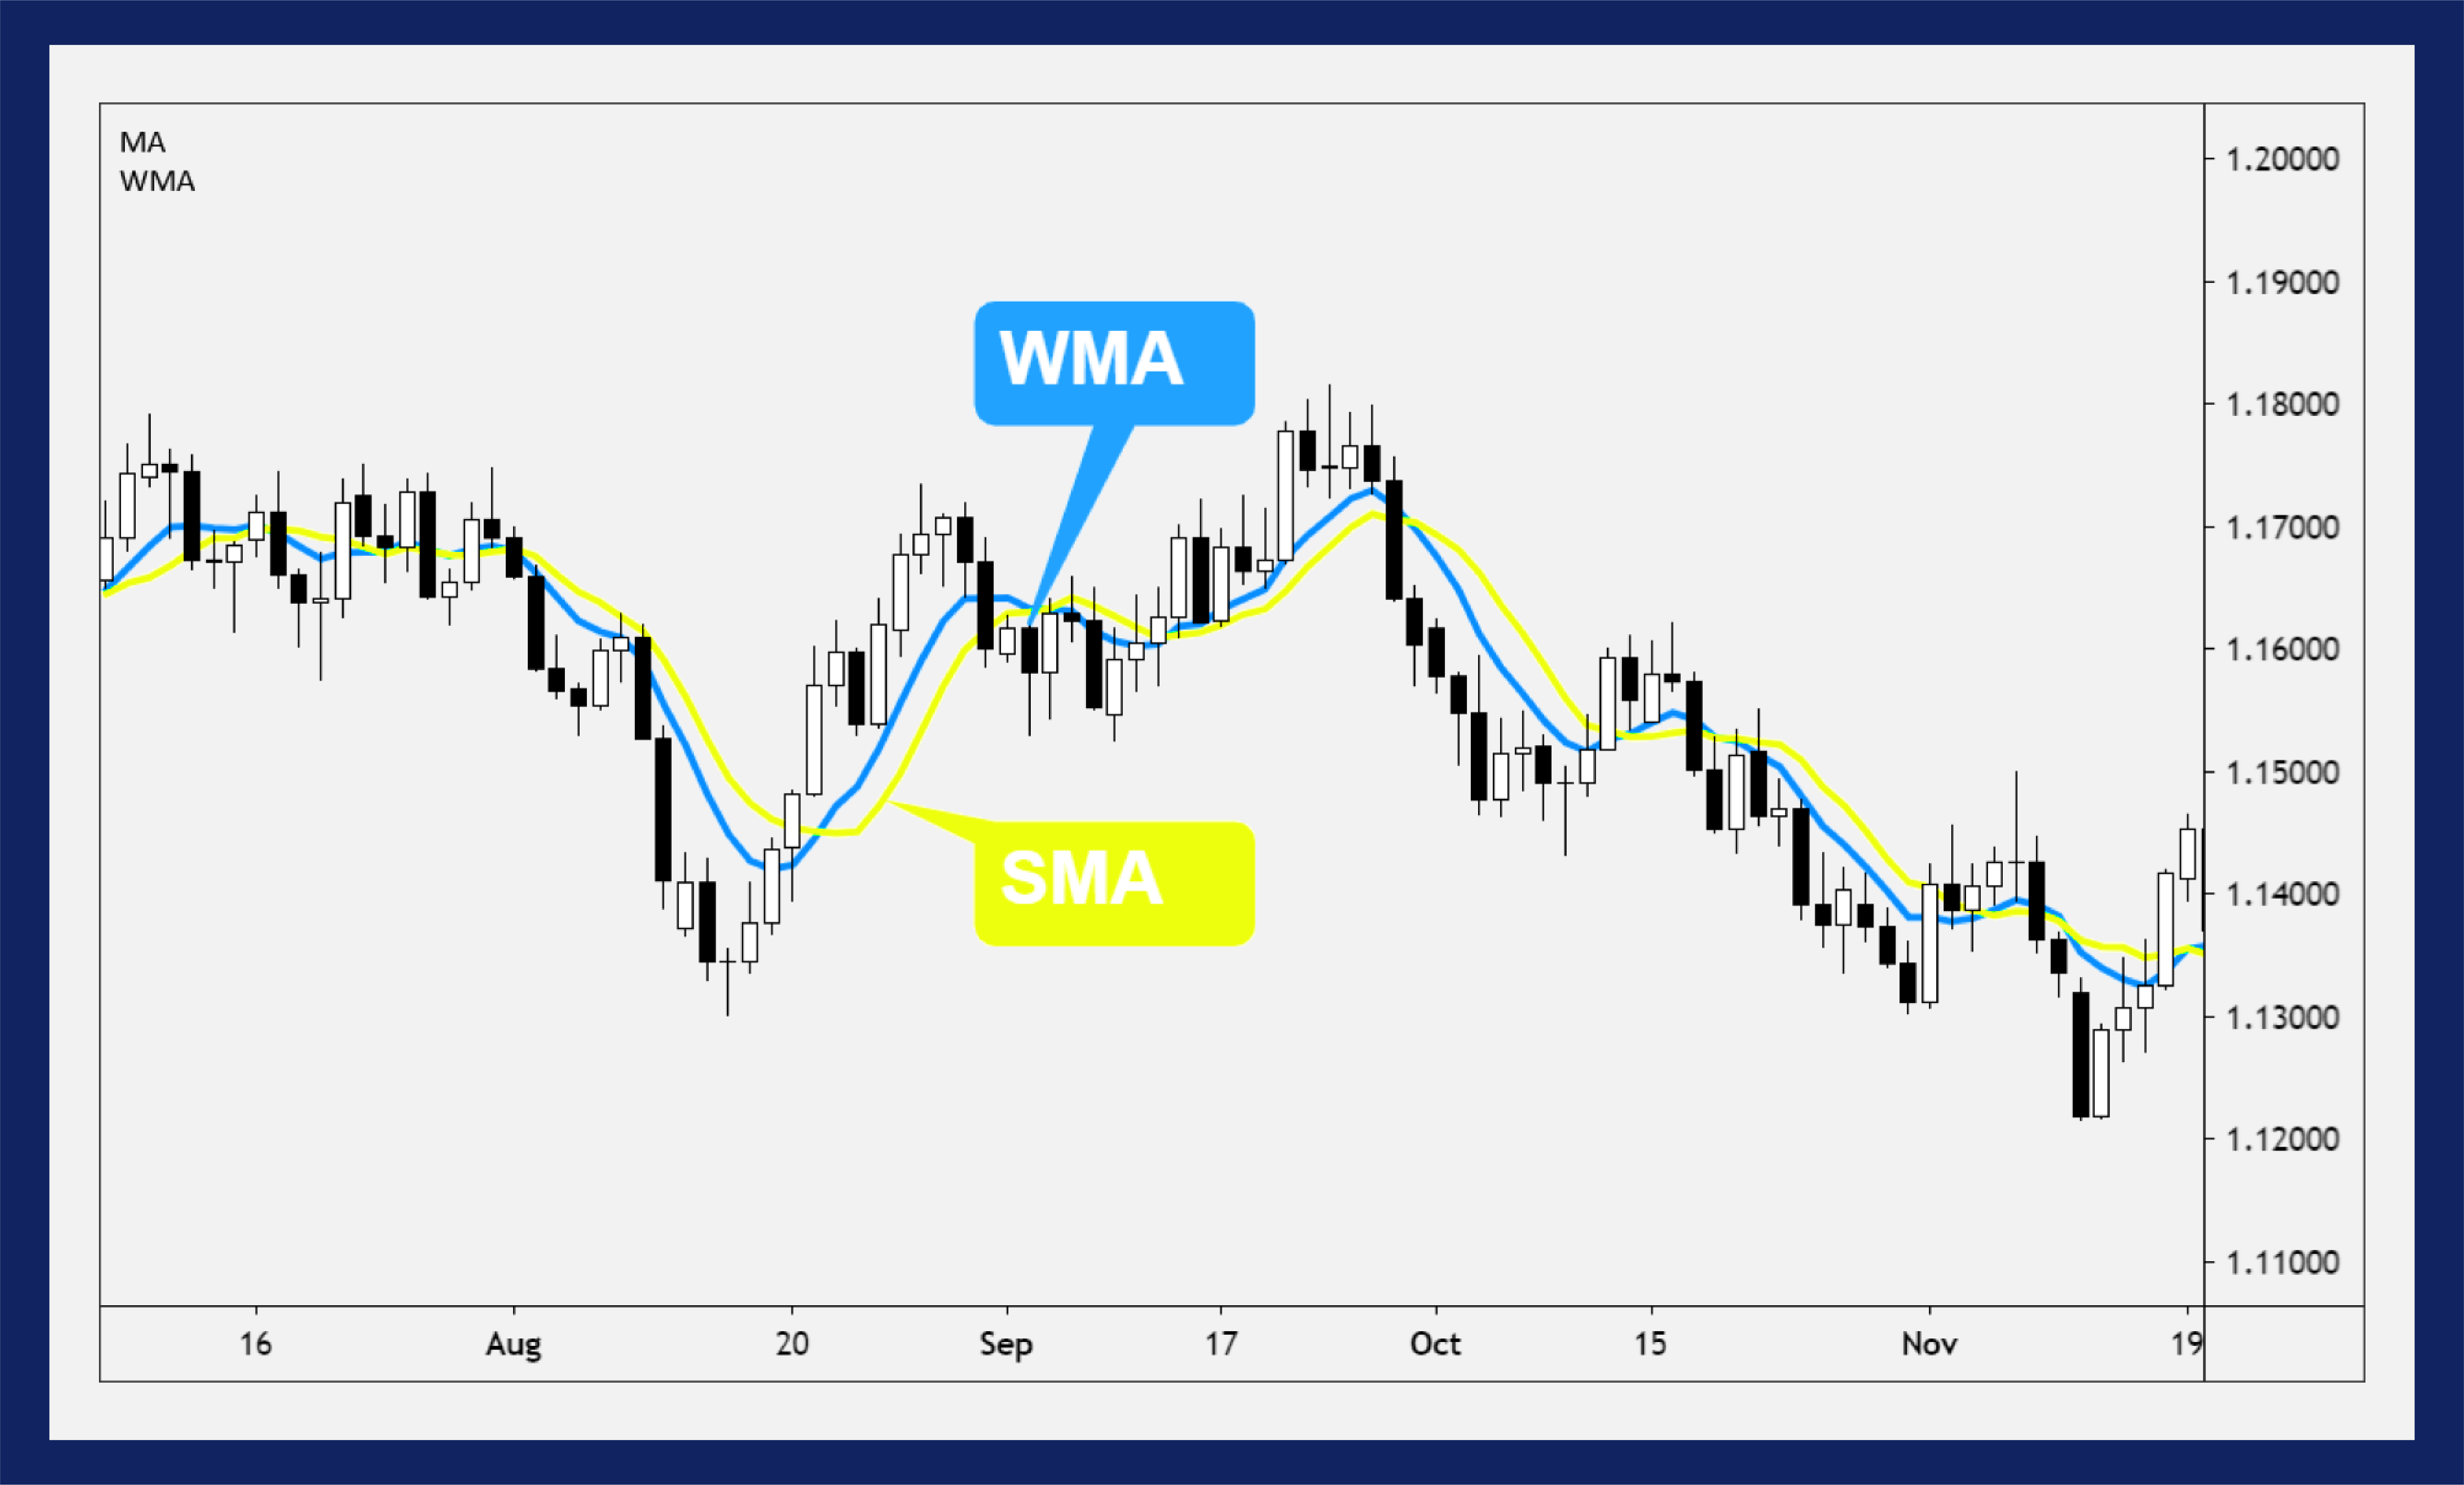
While the simple and exponential moving averages are commonly used by traders, there are other types of moving averages worth exploring. One of these is the weighted moving average (WMA).

The WMA assigns greater weight to the most recent data, making it more responsive to price changes than a simple or exponential moving average. It can be calculated by multiplying each data point by a weight factor that increases linearly with time, and then dividing the sum of these products by the sum of the weight factors.

Another advanced technique with moving averages is the use of multiple moving averages. By combining two or more moving averages with different periods, traders can create a crossover strategy that generates buy and sell signals based on the intersection of the moving averages.
PeriodMoving Average
10Simple Moving Average
20Exponential Moving Average
50Weighted Moving Average

For example, a trader may use a simple moving average with a period of 10 and an exponential moving average with a period of 20. When the simple moving average crosses above the exponential moving average, it may be a signal to buy, and when it crosses below, it may be a signal to sell.

It is important to note that while moving averages can be powerful tools for analyzing trends and making trading decisions, they should not be used in isolation. Traders should always consider other technical indicators and fundamental factors before making any trades.

Conclusion

In conclusion, moving averages are a powerful tool for stock traders. By taking advantage of the trends in stock prices, traders can make informed decisions about when to buy and sell stocks. Whether using a simple moving average or an exponential moving average, traders can use this tool to their advantage.

Furthermore, by understanding moving average crossovers and using advanced techniques such as weighted moving averages, traders can maximize their profits and minimize their risks.

Remember the Formula

It’s important to keep in mind that the moving average formula is not difficult to calculate. By dividing the sum of the stock prices over a specified number of days by the number of days, you can easily calculate a moving average. And with the right moving average trading strategy, you can capitalize on this knowledge.

So, if you’re looking to start trading stocks, we highly recommend adding moving averages to your trading arsenal. With the right knowledge, you can use this tool to your advantage and make informed decisions about your investments.

FAQ

Q: How do I use a moving average to buy stocks?

A: To use a moving average to buy stocks, you need to first select the type of moving average you want to use, such as a simple moving average or an exponential moving average. Then, determine the time period for the moving average, such as 50 days or 200 days. Once you have set up your moving average, you can use it as a tool to help identify potential buying opportunities in the stock market.

Q: What are moving average crossovers and how do they work?

A: Moving average crossovers occur when two different moving averages intersect. This is often used as a signal to buy or sell stocks.

For example, if a shorter-term moving average crosses above a longer-term moving average, it may indicate a bullish trend and a potential buying opportunity. Conversely, if the shorter-term moving average crosses below the longer-term moving average, it may indicate a bearish trend and a potential selling opportunity.

Q: How do I calculate and use moving averages?

A: Moving averages can be calculated by taking the average of a stock’s closing prices over a specific period of time. This calculation is typically done using a simple formula.

Once the moving average is calculated, it can be used as a trend-following indicator to help identify the direction of the stock’s price movement.

Traders often use moving averages to smooth out short-term fluctuations and identify potential buying or selling opportunities.

Q: Are there any advanced techniques I should know about when using moving averages?

A: Yes, there are advanced techniques that can be used with moving average. One example is the weighted moving average, which places more importance on recent data points. This can be useful for traders who want to give more weight to recent price movements. Additionally, moving averages can be combined with other technical indicators, such as the MACD or RSI, to create more sophisticated trading strategies.

Q: What is the conclusion about using moving average?

A: Using moving averages can be a valuable tool for stock traders. They can help identify trends, smooth out price fluctuations, and provide potential buying or selling signals.

However, it’s important to remember that moving averages should not be used as the sole basis for making trading decisions.

They should be used in conjunction with other forms of analysis and risk management techniques to make informed investment choices.
What Is a Candlestick Patterns

If you’re interested in trading, you’ve probably heard of candlestick patterns. These patterns are a type of technical analysis used to understand market trends and predict future price movements. The name “candlestick” comes from the shape of the charts, which resemble candlesticks with a wick on top and a body below.

Candlestick patterns are an important tool for traders to use because they can show when a trend is changing, and whether an asset is likely to go up or down in value. They provide valuable information for making informed decisions and can help traders reduce risk and increase profits

Before we dive into the details of trading risk management, let’s first understand what it is. Trading risk management is a set of strategies and practices that traders use to minimize their exposure to potential financial losses. It is a crucial component of any successful trading strategy. Without proper risk management, traders can easily lose all their capital in a single trade.

Risk management aims to protect traders from such catastrophic losses by limiting their exposure to risks and ensuring that they have enough capital to continue trading.

Bearish candlestick patterns, on the other hand, indicate that the price of an asset is likely to decline. These patterns are characterized by a long red or black candlestick that signals selling pressure and a bearish sentiment.

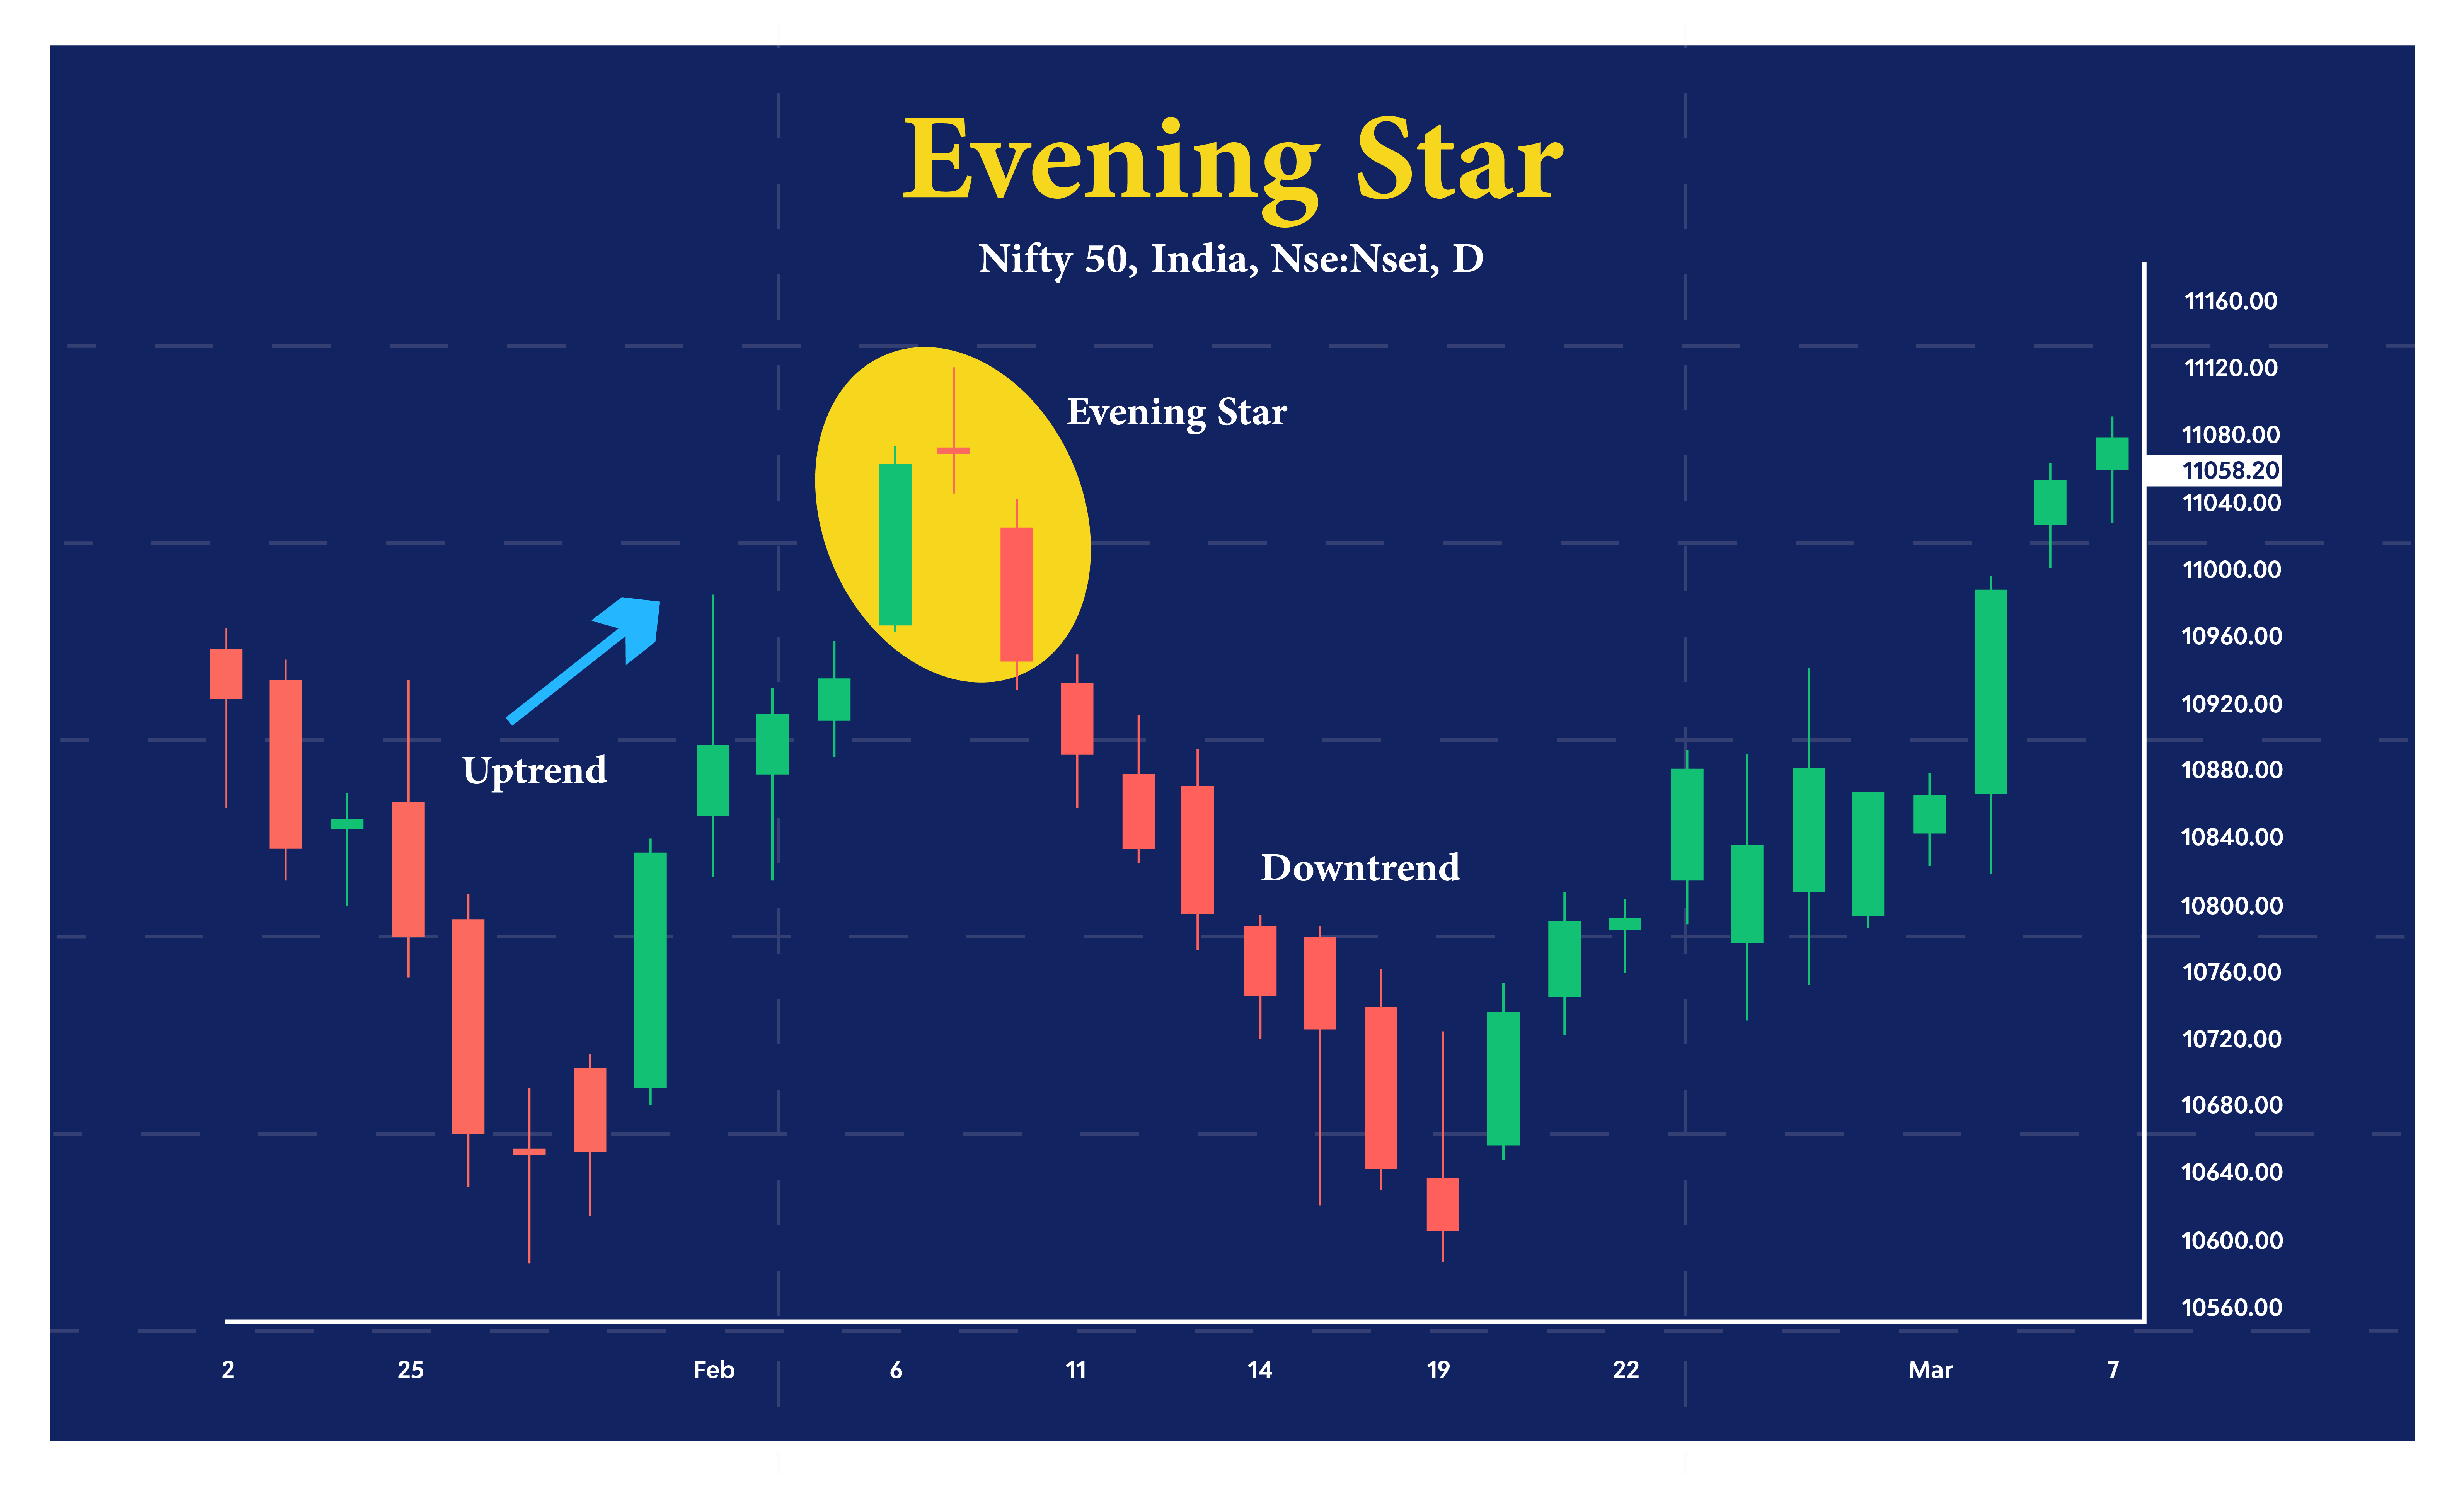
Examples of commonly recognized patterns for bearish conditions include the shooting star, the evening star, and the doji pattern.

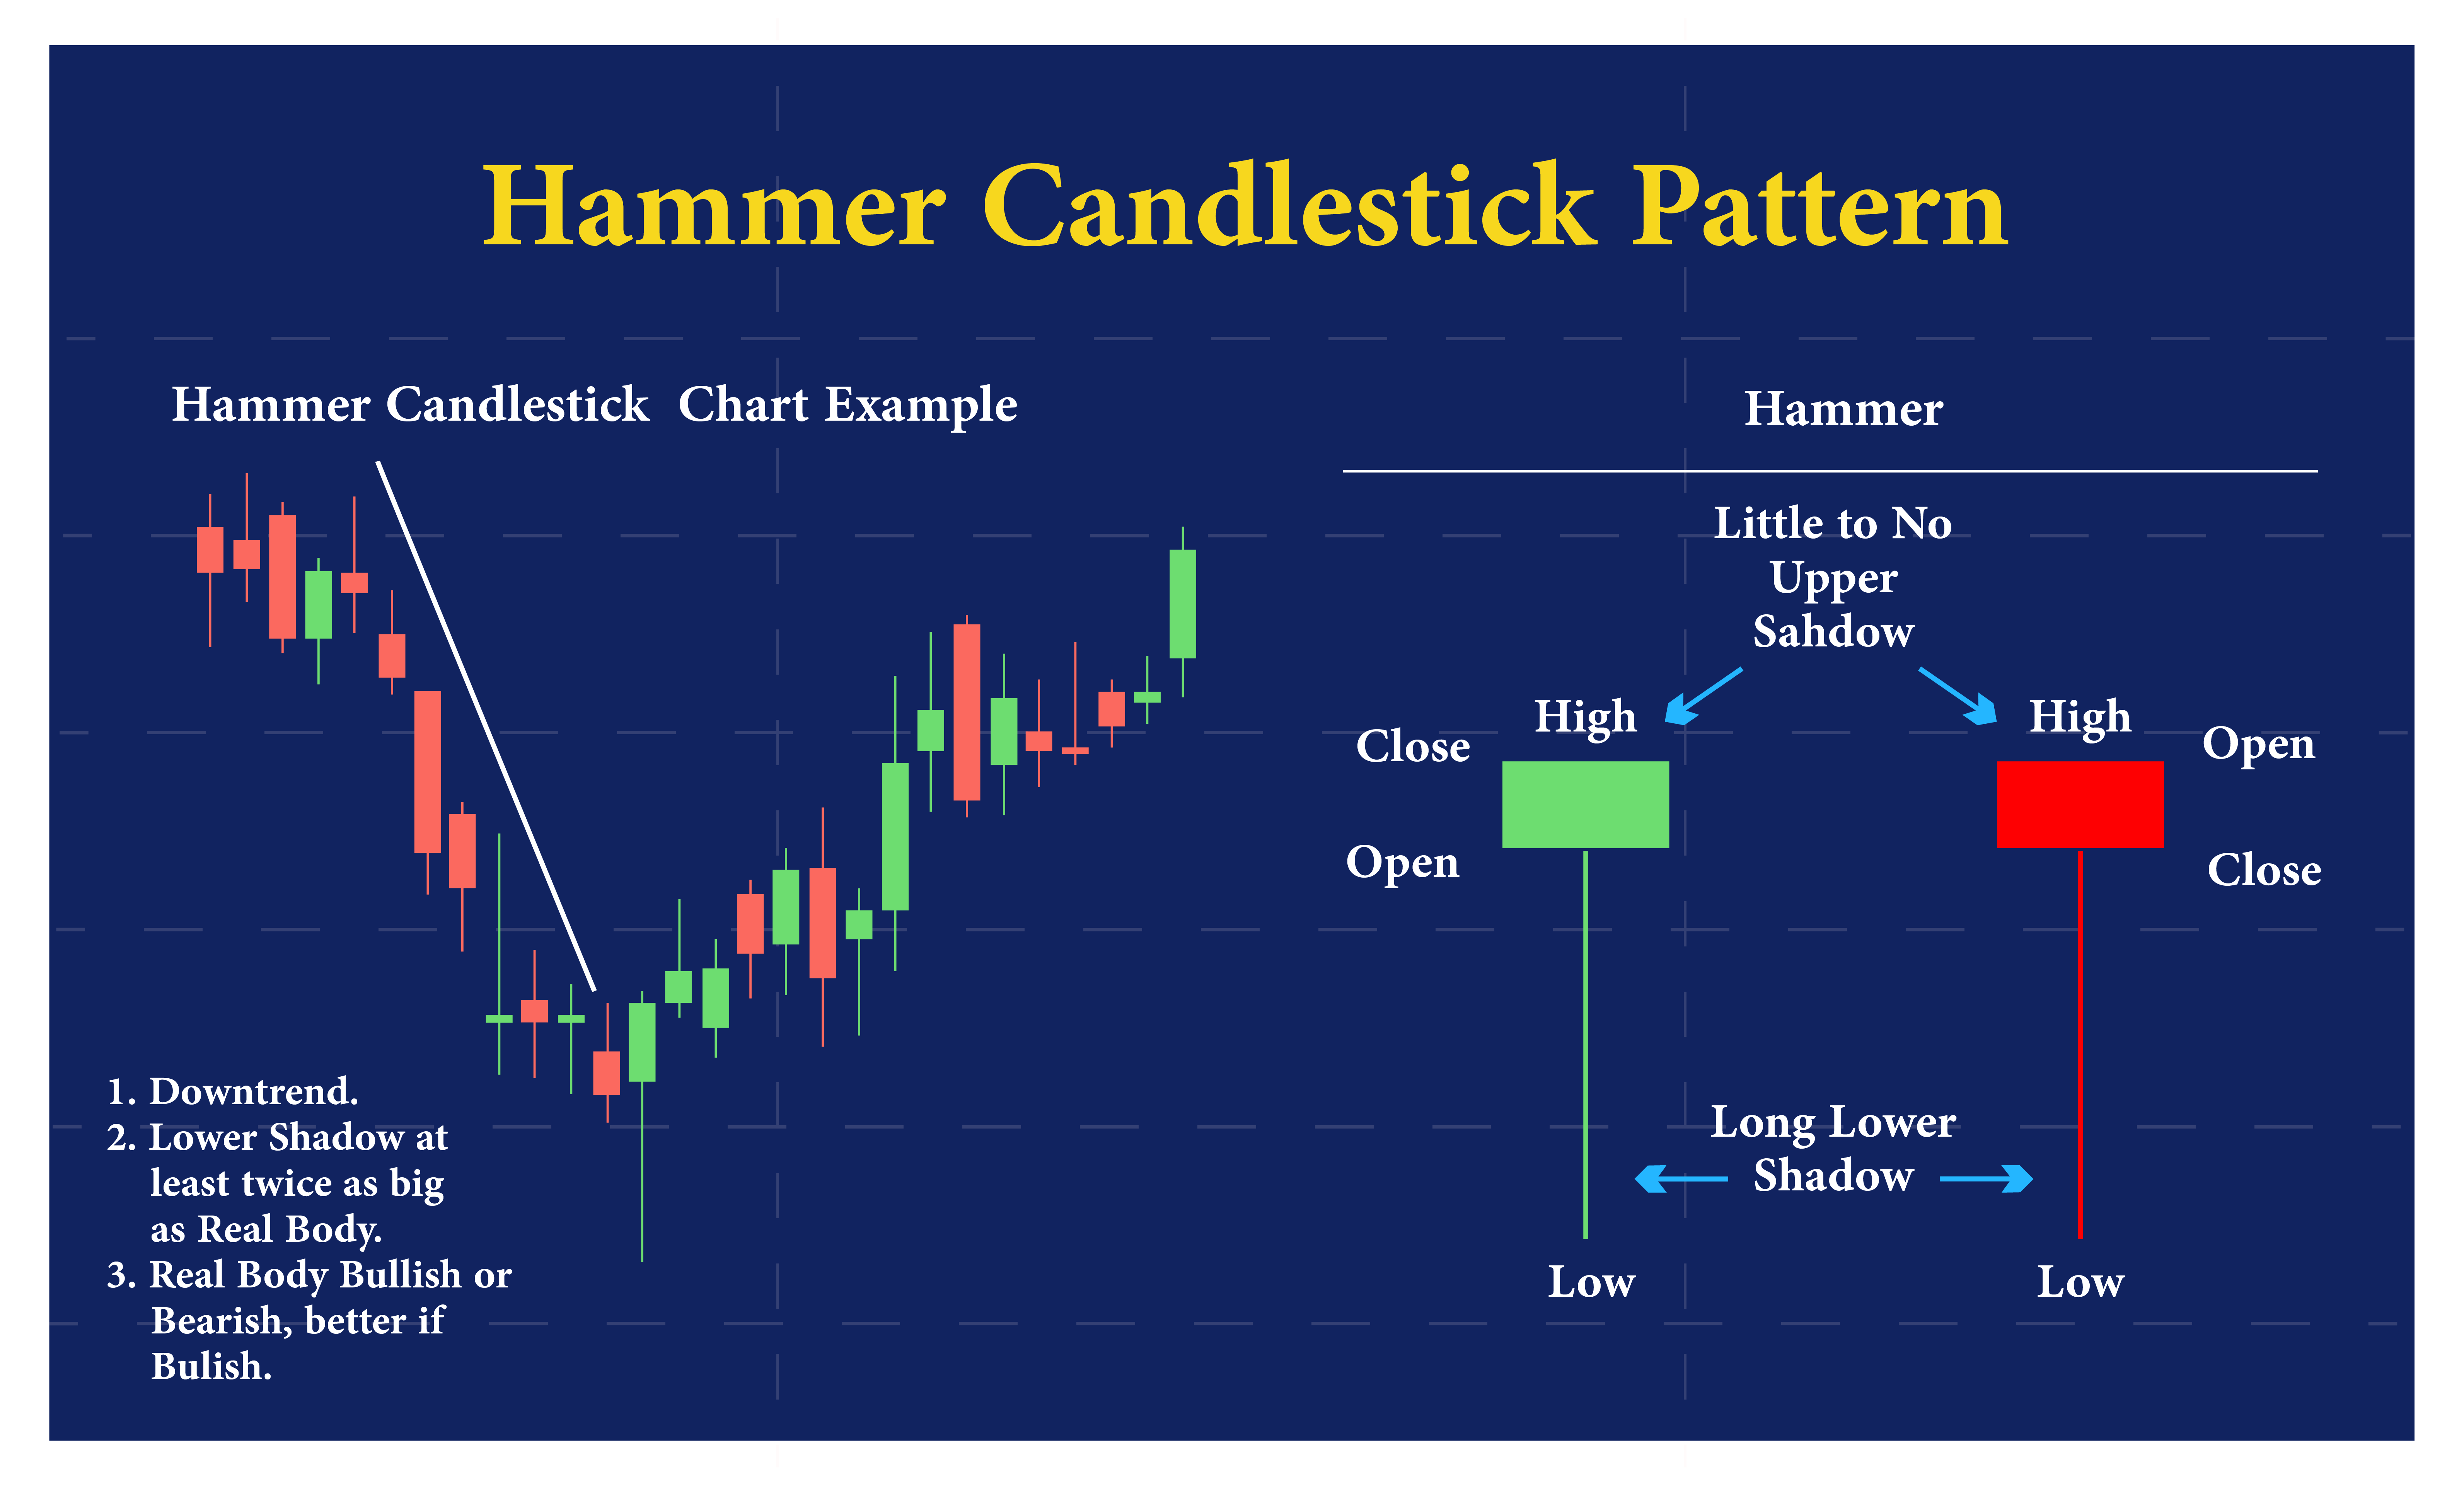
Hammer Candlestick Patterns

The Hammer: This pattern occurs when a candlestick has a small body and a long lower wick. It indicates that buyers are stepping in after a period of selling pressure and that the price may be ready to reverse.

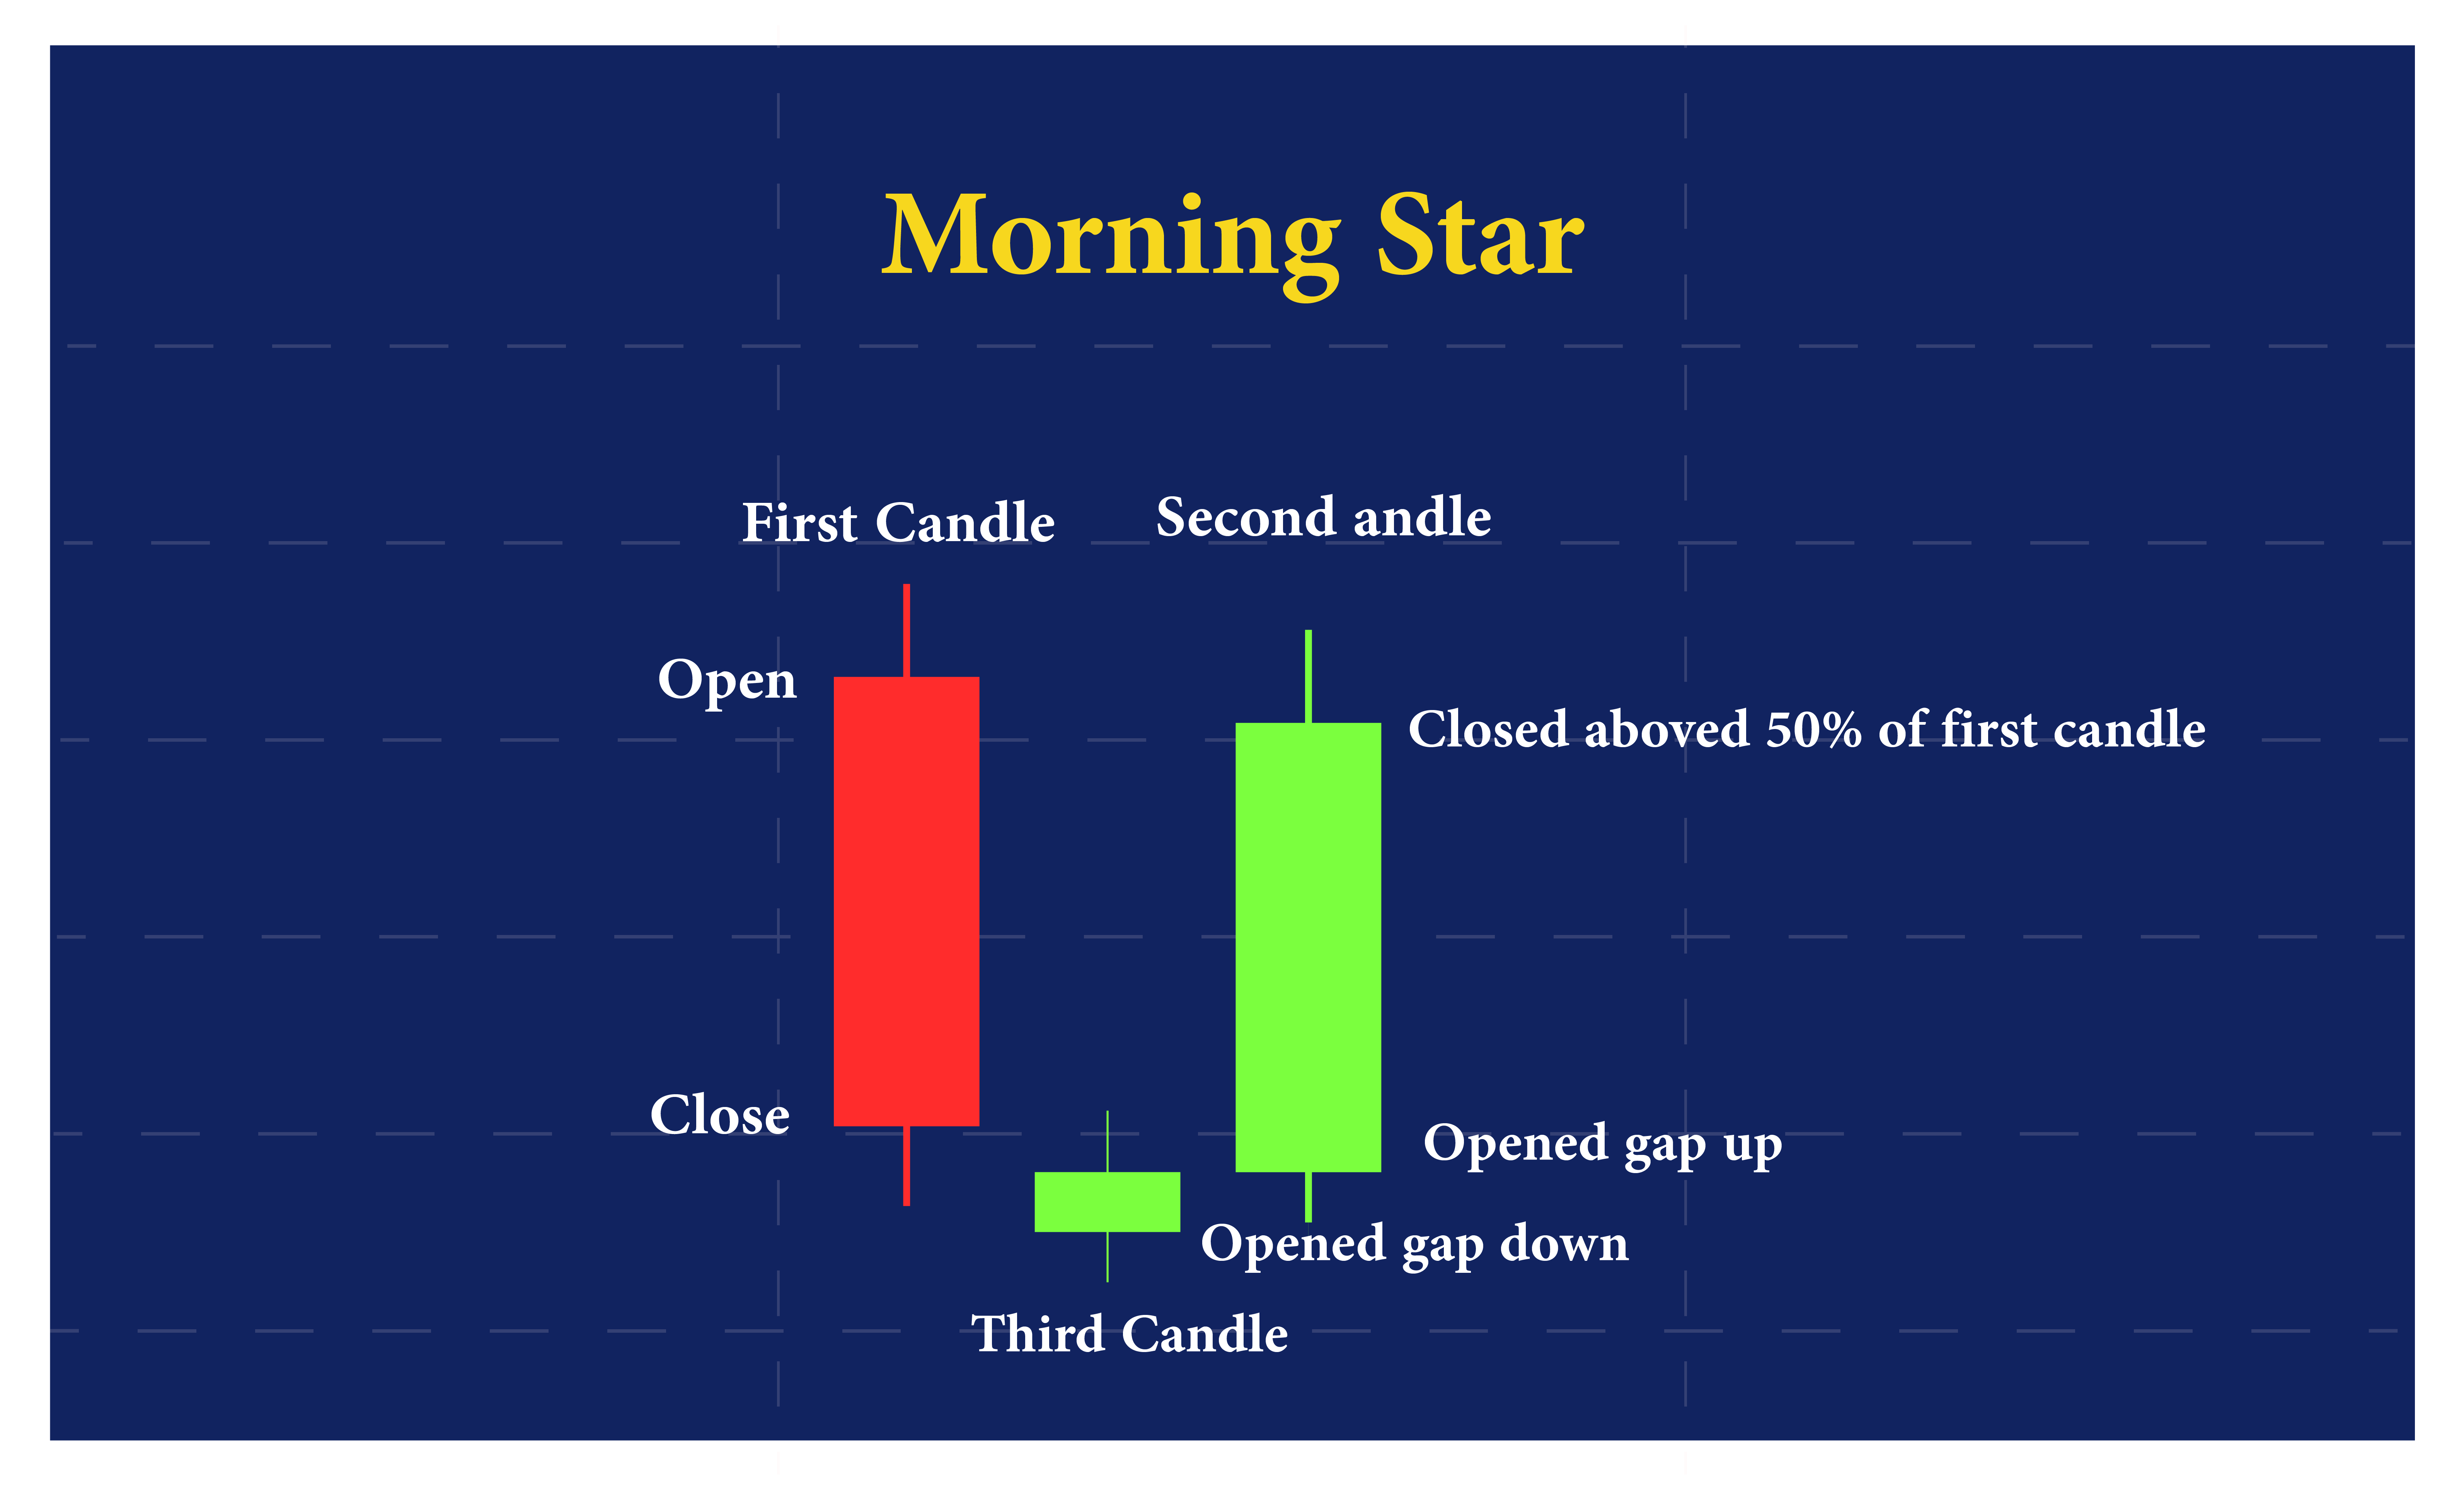
Morning Star Candlestick Pattern

The Morning Star: This pattern is formed when a long red candlestick is followed by a small-bodied candlestick that gaps lower. The third candlestick in the pattern is a long green candlestick that closes above the midpoint of the first candlestick. It signals a potential shift in momentum from bearish to bullish.

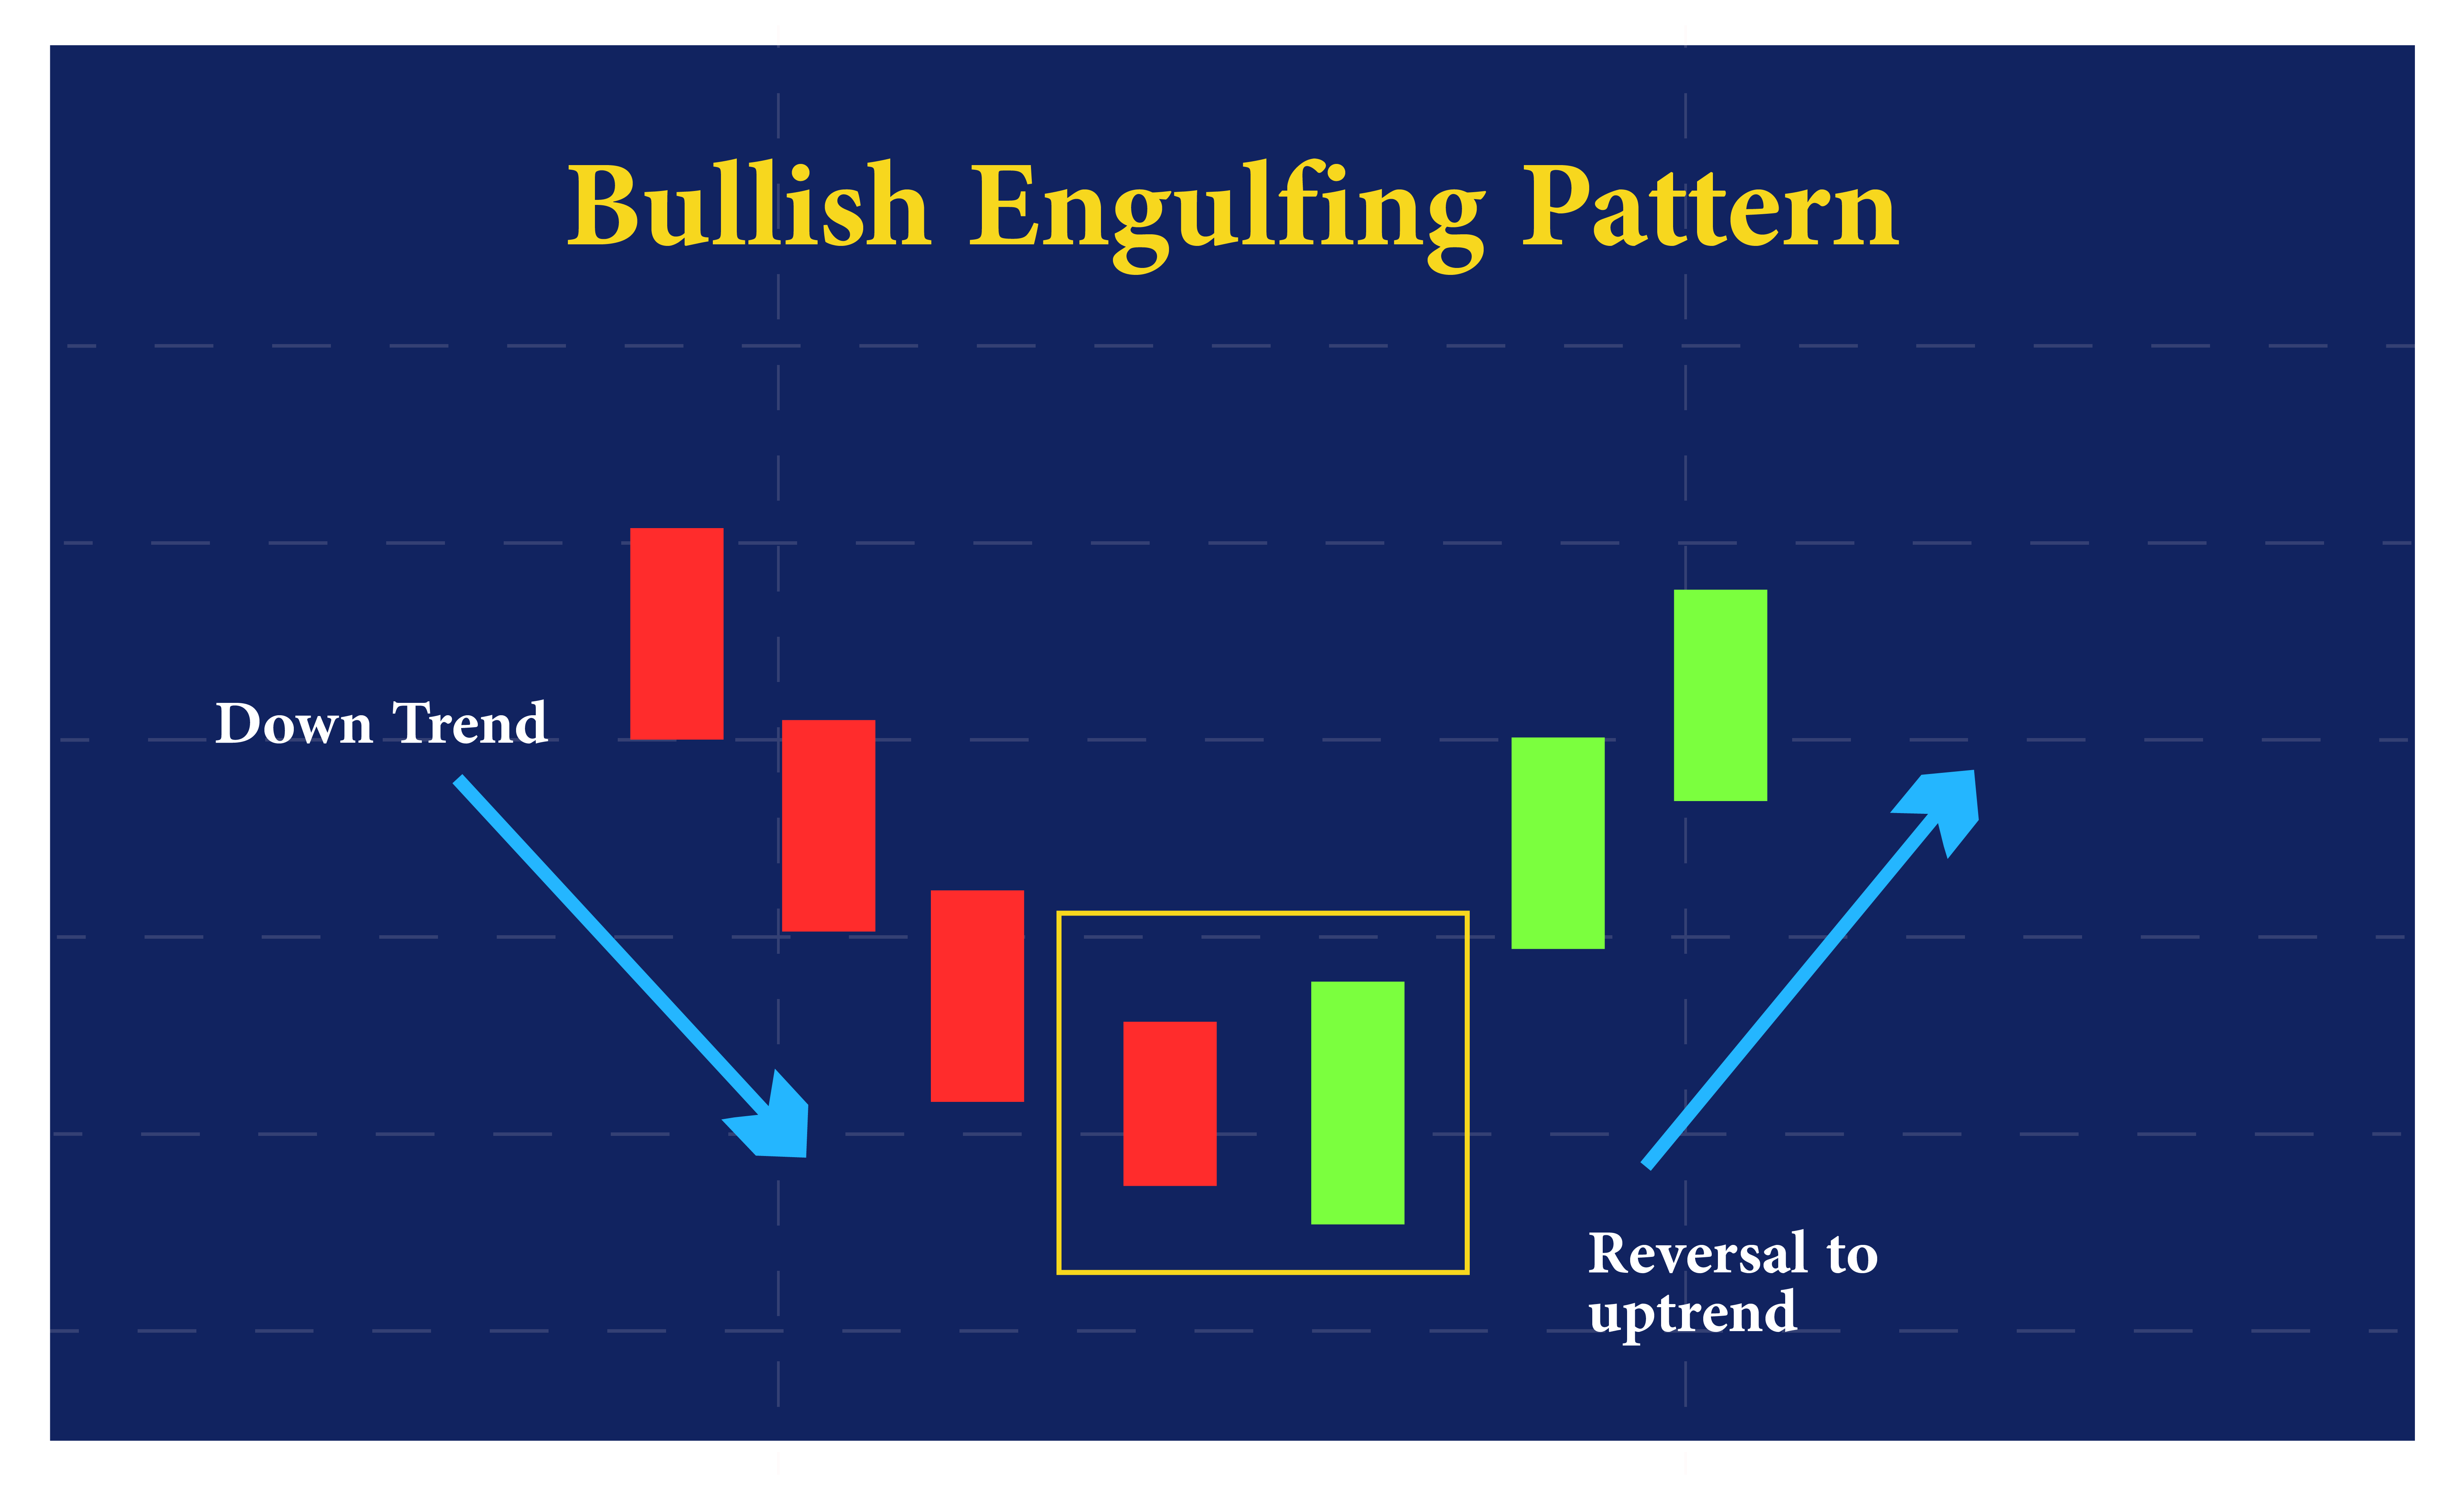
Bullish Engulfing Candlestick Pattern

The Engulfing Pattern: This pattern occurs when a small-bodied candlestick is followed by a larger candlestick that completely engulfs the first one. It signals a reversal in sentiment and a potential shift in the direction of the price.

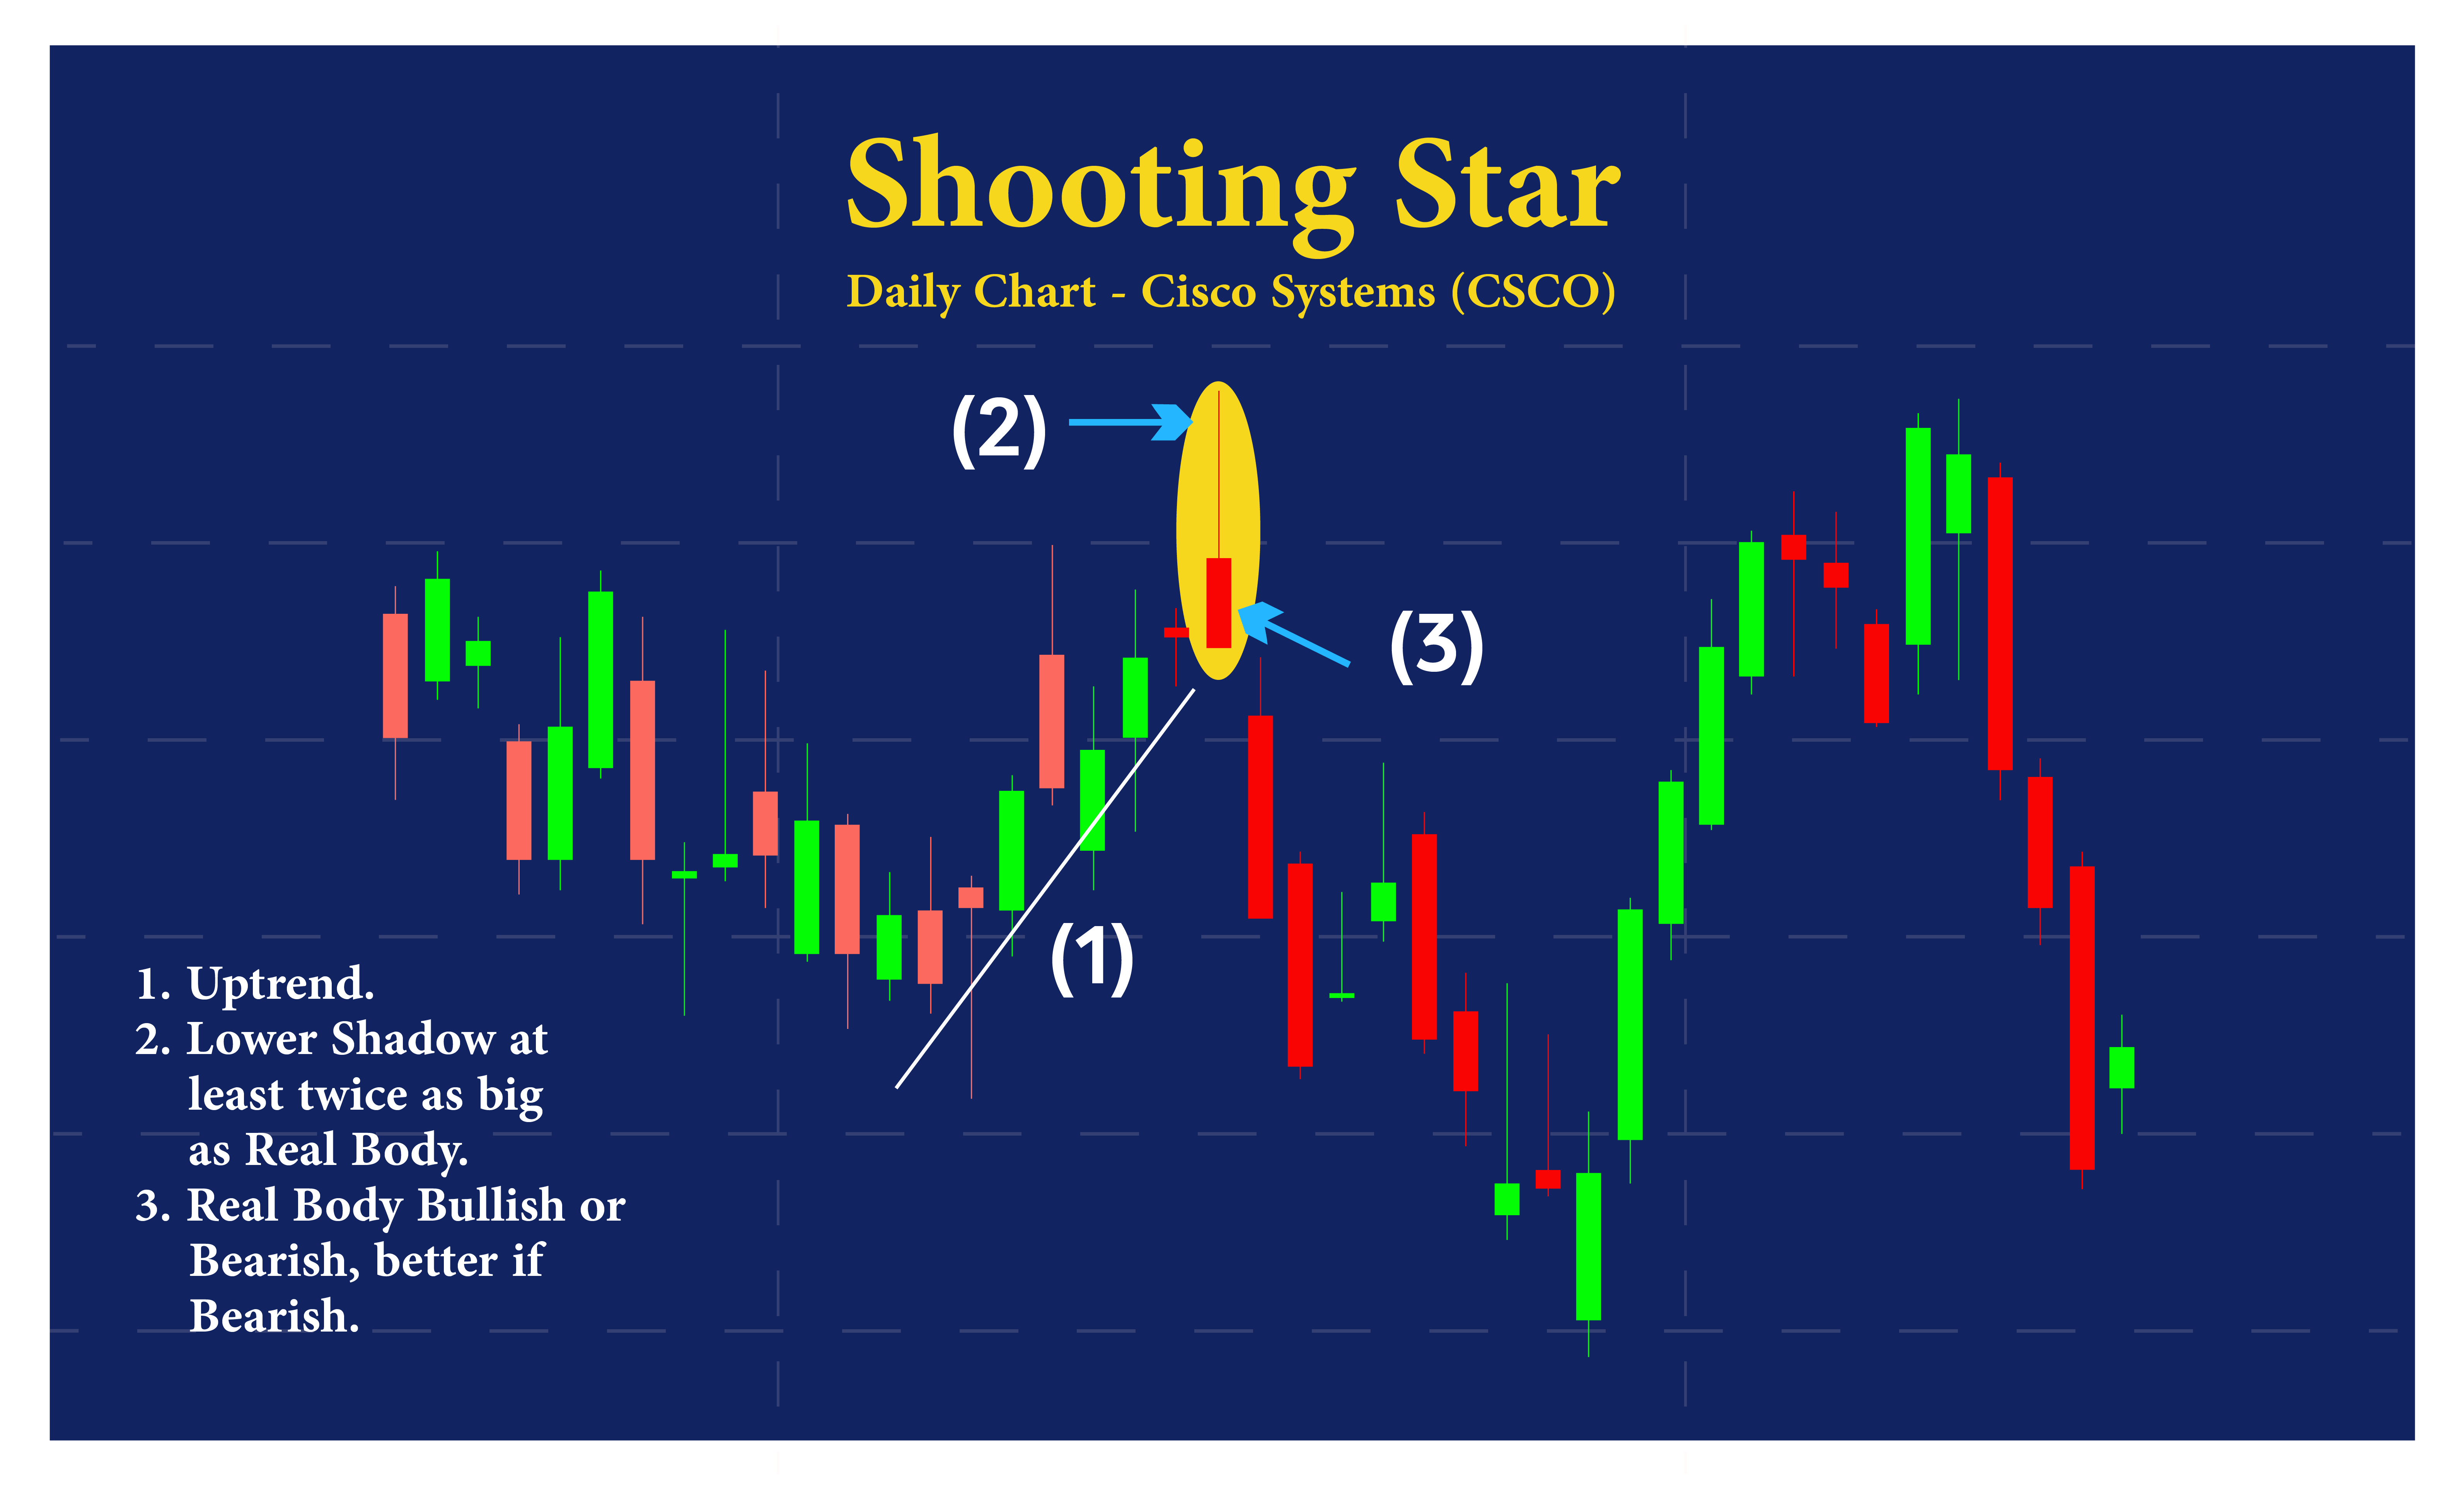
Bearish Shooting Star Candlestick Pattern

The Shooting Star: This pattern is characterized by a small body and a long upper wick. It indicates that buyers pushed prices higher during the session, but sellers ultimately took control and pushed prices back down.

Evening Star Candlestick Pattern

The Evening Star: This is a three-candle pattern that signals a shift from bullish to bearish sentiment. The first candlestick is a long green candlestick, followed by a small-bodied candlestick that gaps higher. The third candlestick is a long red candlestick that closes below the midpoint of the first candlestick.

The Doji Pattern: This pattern is characterized by a small-bodied candlestick with a long upper and lower wick. It signals indecision in the market and suggests that neither buyers nor sellers have control over the price.

Understanding these candlestick patterns is an essential part of technical analysis, as they can provide valuable insights into market sentiment and potential price movements.

By recognizing these patterns and incorporating them into their trading strategies, traders can make more informed decisions and improve their chances of success.

There are several common types of candlestick patterns that traders encounter. Each pattern has its unique significance and can be useful for informing trading strategies. Here are some key types of candlestick patterns:

Candlestick Pattern

Description

Implications

Hammer Candlestick

A small candlestick with a long lower wick and a short upper wick, indicating a bullish reversal.

Traders may interpret this pattern as a signal to buy.

Shooting

Star Candlestick

A small candlestick with a long upper wick and a short lower wick, indicating a bearish reversal.

Traders may interpret this pattern as a signal to sell.

Doji Candlestick

A candlestick with a small body and long upper and lower wicks, indicating indecision in the market.

Traders may interpret this pattern as a signal to wait for further confirmation before making a trading decision.

Engulfing Candlestick Pattern

A pattern where a bearish candlestick is followed by a bullish candlestick with a higher high and a lower low, indicating a bullish reversal.

Traders may interpret this pattern as a signal to buy.

Evening Star Candlestick

A bearish reversal pattern where a long bullish candlestick is followed by a small doji, and then a long bearish candlestick.

Traders may interpret this pattern as a signal to sell.

Morning Star Candlestick

A bullish reversal pattern where a long bearish candlestick is followed by a small doji, and then a long bullish candlestick.

Traders may interpret this pattern as a signal to buy.

It’s worth noting that while these patterns can be useful for informing trading strategies, they should not be relied on in isolation. It’s essential to consider other technical indicators and market trends before making trading decisions.

While candlestick patterns can provide valuable insights into market conditions, incorporating them into a trading strategy requires careful consideration of multiple factors. Here are some techniques that traders use to make the most of candlestick patterns:

Before analyzing individual candlestick patterns, it’s essential to identify the primary trend in the market. This can be done by analyzing longer-term charts and looking for patterns such as higher highs and higher lows in an uptrend or lower highs and lower lows in a downtrend.

Once the primary trend is identified, traders can use candlestick patterns to identify potential entry and exit points within that trend.

Candlestick patterns can be more powerful when used in conjunction with other technical indicators such as moving averages, oscillators, or trendlines. For example, a bullish candlestick pattern occurring at a support level identified through trendline analysis can provide a strong bullish signal.

While a single candlestick pattern may provide a signal for a potential price movement, it’s often prudent to wait for confirmation before taking action.

Confirmation signals can come from other candlestick patterns, technical indicators, or price action in subsequent periods.

For example, a bullish engulfing pattern followed by a strong price rally in the next few periods can provide confirmation that the bullish signal was accurate.

By combining candlestick patterns with other technical analysis tools and waiting for confirmation signals, traders can more effectively incorporate these patterns into their trading strategies.

However, it’s essential to remember that no single indicator is foolproof, and traders should always consider the broader market context before making any trading decisions.

Overall, candlestick patterns are an essential tool for traders looking to make informed decisions in the financial markets. By understanding the different types of patterns, traders can gain insights into market sentiment and potential price movements.

When incorporating candlestick patterns into trading strategies, it’s important to consider the context in which they occur and use confirmation signals to increase the probability of success. By doing so, traders can mitigate risk while maximizing potential profits.

Whether you’re a seasoned trader or just starting out, learning how to read and interpret candlestick patterns can be a game-changer for your trading success.

By taking the time to study and understand these patterns, you can gain a deeper understanding of the markets and make more informed decisions.

Remember, trading is a dynamic and constantly evolving process, and candlestick patterns are just one tool in the trader’s arsenal.

However, by incorporating them into your trading strategy, you can increase your chances of success and achieve your financial goals.

The Pros and Cons of Trading Leverage: Is it Worth the Risk?

In the world of financial trading, leverage is a concept that can be both enticing and intimidating. It allows traders to amplify their potential profits by borrowing money to trade with, but it also increases the risk of significant losses.

As with any investment strategy, trading leverage comes with its own set of pros and cons that every trader should carefully consider before diving in. On one hand, leverage can provide traders with the opportunity to make substantial gains with a relatively small investment.

It allows them to take larger positions in the market and potentially increase their returns. However, on the other hand, trading with leverage can be a double-edged sword.

The same magnification that can lead to big profits can also result in devastating losses if the market moves against the trader. This article will delve into the pros and cons of trading leverage, exploring whether the potential rewards are worth the inherent risks.

Leverage, in the context of trading, refers to the use of borrowed funds to increase the potential return on an investment. It allows traders to control a larger position in the market than what they would be able to afford with their own capital alone.

For example, a trader with $1,000 in their account can use leverage to control a position worth $10,000 or more. This is achieved by borrowing money from the broker and using it as additional capital to trade with. The borrowed funds act as a loan, which the trader is required to repay, usually with interest, once the trade is closed.

Leverage is typically expressed as a ratio, such as 1:100 or 1:500. The first number represents the trader’s own capital, while the second number represents the borrowed funds. For example, a leverage ratio of 1:100 means that for every $1 of the trader’s capital, they can control $100 in the market. Higher leverage ratios allow for greater potential returns, but also increase the risk of losses.

While leverage can be a powerful tool for traders, it is important to understand that it amplifies both profits and losses. A small move in the market can result in significant gains or losses, depending on the direction of the trade. This is why trading with leverage requires careful risk management and a thorough understanding of the potential risks involved.

Trading with leverage offers several potential advantages for traders. Here are some of the pros of using leverage in trading:

1.Increased profit potential: Trading with leverage allows traders to control larger positions in the market with a smaller investment. This means that even a small price movement can result in a significant profit.

For example, if a trader with $1,000 in their account uses leverage to control a position worth $10,000, a 1% increase in the price of the asset would result in a $100 profit, or a 10% return on their initial investment.

2. Diversification: Leverage allows traders to diversify their trading portfolio by taking positions in multiple assets or markets. This can help spread the risk and potentially increase the chances of finding profitable opportunities.

By using leverage, traders can allocate their capital across different assets without having to invest a large amount of money in each individual trade.

3. Access to larger markets: Trading with leverage opens up opportunities to trade in larger markets that may otherwise be inaccessible to individual traders. For example, the forex market, which is the largest and most liquid market in the world, requires significant capital to trade without leverage.

With leverage, traders can participate in the forex market with a relatively small investment, giving them exposure to a wide range of currency pairs and trading opportunities.

4. Flexibility: Leverage offers traders the flexibility to adjust their trading strategies based on market conditions. It allows them to take advantage of short-term price movements and capitalize on market trends.

Traders can enter and exit positions quickly, taking advantage of opportunities as they arise. This flexibility can be particularly beneficial in volatile markets where prices can change rapidly.

5. Hedging: Leverage can be used as a hedging tool to protect against potential losses. By taking a position in the opposite direction to their initial trade, traders can offset potential losses and minimize their risk.

This strategy, known as hedging, can be particularly useful in uncertain market conditions or when traders want to protect their portfolio from adverse market movements.

While these advantages make trading with leverage appealing, it is important to note that they come with their fair share of risks.

Traders must carefully consider the potential downsides before deciding to use leverage in their trading strategies.

Trading with leverage carries inherent risks that traders must be aware of. Here are some of the cons of using leverage in trading:

1. Increased risk of losses: The same magnification that allows for potential profits also increases the risk of losses. Since leverage amplifies the size of a trade, even a small price movement against the trader’s position can result in significant losses.

If the market moves in the opposite direction to what the trader anticipated, they may end up owing more money to the broker than their initial investment.

2. Margin calls: When trading with leverage, traders are required to maintain a certain level of funds in their trading account, known as the margin. If the value of their positions falls below a certain threshold, the broker may issue a margin call, requiring the trader to deposit additional funds into their account to meet the margin requirements. Failing to do so may result in the broker closing the trader’s positions to limit the risk of further losses.

3. Higher transaction costs: Trading with leverage often comes with higher transaction costs, including interest charges on borrowed funds and additional fees imposed by the broker. These costs can eat into potential profits and reduce the overall return on investment. Traders must carefully consider these costs when evaluating the potential benefits of using leverage.

4. Emotional stress: The amplified nature of leverage can lead to increased emotional stress for traders. Large losses can be emotionally challenging to handle and may lead to impulsive decision-making or irrational behavior. Traders must have a strong emotional discipline and be able to manage their emotions effectively to avoid making costly mistakes.

5. Limited risk management options: While leverage can be used as a risk management tool through hedging, it also limits the available risk management options. For example, since leverage requires traders to maintain a certain margin level, they may not have enough funds to implement other risk management techniques, such as stop-loss orders or take-profit orders. This can leave traders exposed to potential losses without a clear exit strategy.

It is important for traders to carefully evaluate these risks and weigh them against the potential rewards before deciding to trade with leverage. Understanding the risks associated with leverage is crucial for implementing effective risk management strategies and protecting one’s trading capital.

Before using leverage in trading, it is essential to understand the risks involved. Here are some key risks associated with trading leverage:

1. Market volatility: Leverage amplifies both profits and losses, making traders more vulnerable to market volatility. Sudden price movements can result in significant gains or losses, depending on the direction of the trade. Traders must be prepared for increased market volatility when trading with leverage and have a clear understanding of the potential impact on their positions.

2. Liquidity risk: In highly leveraged positions, the size of the trade may exceed the available liquidity in the market. This can make it difficult to execute trades at desired prices, especially during fast market movements or in illiquid markets. Traders must be aware of the potential liquidity risks associated with their positions and consider the impact on their ability to enter or exit trades.

3. Overtrading: The allure of potential profits can tempt traders to overtrade when using leverage. Overtrading refers to excessive trading activity driven by emotions or impulsive decision-making, rather than a well-thought-out trading strategy. Overtrading can lead to increased transaction costs, higher risk exposure, and a higher likelihood of making costly mistakes.

4. Unpredictable market events: Financial markets can be influenced by unexpected events, such as economic data releases, geopolitical events, or natural disasters. These events can cause sharp and sudden price movements, resulting in significant gains or losses for traders. When trading with leverage, traders must be prepared for the possibility of unpredictable market events and have appropriate risk management strategies in place.

5. Counterparty risk: When trading with leverage, traders rely on their brokers to provide the borrowed funds and execute their trades. There is always a risk that the broker may default on their obligations, leading to potential losses for the trader. Traders must choose reputable brokers with strong financial backing and regulatory oversight to minimize the counterparty risk.

By understanding these risks and implementing proper risk management strategies, traders can mitigate the potential downsides of trading with leverage and increase their chances of success.

Before deciding to use leverage in trading, there are several important factors to consider. These factors can help traders determine whether trading with leverage is suitable for their individual circumstances and risk tolerance. Here are some key factors to consider:

1. Financial situation: Traders must assess their financial situation and determine whether they can afford to take on the additional risk associated with trading leverage. They should consider their available capital, income, and overall financial stability. It is important to only use leverage with funds that can be comfortably risked without causing financial hardship.

2. Trading experience: Trading with leverage requires a certain level of knowledge and experience. Traders should have a solid understanding of the underlying market, trading strategies, and risk management techniques. It is advisable for novice traders to gain experience in trading without leverage before venturing into leveraged trading.

3. Risk tolerance: Every trader has a different risk tolerance level. Traders must assess their risk tolerance and determine whether they are comfortable with the potential losses that can result from trading with leverage. It is important to be honest with oneself and avoid taking on excessive risk that may lead to emotional distress or financial hardship.

4. Market conditions: Traders must assess the current market conditions and determine whether they are conducive to trading with leverage. Volatile and unpredictable markets may not be suitable for leveraged trading, as they can increase the likelihood of significant losses. Traders should consider the stability and liquidity of the market before deciding to use leverage.

5. Risk management strategy: Having a well-defined risk management strategy is crucial when trading with leverage. Traders should have clear rules in place for setting stop-loss orders, take-profit orders, and managing their positions. They should also be prepared to adjust their risk management strategy based on market conditions or unexpected events.

By carefully considering these factors, traders can make informed decisions about whether to use leverage in their trading strategies. It is important to remember that trading with leverage is not suitable for everyone and should be approached with caution.

Effective risk management is essential when trading with leverage. Here are some strategies to help traders manage their leverage effectively:

1. Set realistic leverage ratios: Traders should avoid using the maximum leverage offered by their brokers and instead set realistic leverage ratios based on their risk tolerance and trading strategy. Lower leverage ratios can help reduce the potential losses and allow for more flexibility in managing positions.

2. Use stop-loss orders : Stop-loss orders are orders placed with the broker to automatically close a position if the price reaches a predetermined level. Traders should use stop-loss orders to limit their potential losses and protect their capital. It is important to set stop-loss levels based on careful analysis of market conditions and avoid placing them too close to the entry price, as this can result in premature exits.

3. Diversify the trading portfolio: Diversification is an effective risk management strategy that can help reduce the impact of individual trades on the overall portfolio. Traders should diversify their trading portfolio by taking positions in different assets or markets. This can help spread the risk and potentially offset losses in one trade with gains in another.

4. Continuously monitor positions : When trading with leverage, it is crucial to closely monitor positions and stay updated on market developments. Traders should regularly review their positions, analyze market trends, and adjust their strategies if necessary. Staying informed and proactive can help prevent unexpected losses and increase the chances of making profitable trades.

5. Practice risk-reward analysis : Before entering a trade, traders should conduct a risk-reward analysis to assess the potential gains and losses. This involves evaluating the potential profit target and comparing it to the potential loss if the trade goes against them. Traders should only take trades with a favorable risk-reward ratio, where the potential reward outweighs the potential risk.

By implementing these strategies, traders can effectively manage their leverage and reduce the potential risks associated with trading on margin.

Trading with leverage has the potential to generate substantial profits for traders. Here are some real-life examples of trading leverage success stories:

1. George Soros: George Soros is a renowned investor and hedge fund manager who famously made a billion-dollar profit by shorting the British pound in 1992. Soros used leverage to amplify his position and bet against the pound, which was facing pressure due to the European Exchange Rate Mechanism. His successful trade resulted in significant gains and earned him the title of “the man who broke the Bank of England.”

2. John Paulson: John Paulson is another well-known investor who made billions of dollars by betting against subprime mortgages during the 2008 financial crisis. Paulson’s hedge fund used leverage to take short positions on mortgage-backed securities, anticipating the collapse of the housing market. His successful trades generated massive profits and established him as one of the most successful investors of his time.

These success stories highlight the potential rewards that trading with leverage can offer. However, it is important to note that these examples involve highly experienced and skilled traders who carefully analyzed market conditions and implemented effective risk management strategies.

While trading with leverage can lead to significant profits, it can also result in substantial losses. Here are some real-life examples of trading leverage failures:

1. Long-Term Capital Management: Long-Term Capital Management (LTCM) was a hedge fund that collapsed in 1998, resulting in significant losses for its investors. LTCM used leverage to take highly leveraged positions in various markets, including fixed-income securities and derivatives. However, the fund’s trades turned against them, leading to massive losses and the eventual collapse of the fund.

2. Individual traders: There have been numerous cases of individual traders experiencing substantial losses when trading


The Pros and Cons of Spot Stock Trading: Is It Right for You?

Are you someone who is interested in investing in the stock market but doesn’t have the time or expertise to dive into the world of long-term investments? Spot stock trading could be the solution for you. As one of the most popular forms of stock trading, it offers the potential for quick profits and a fast-paced trading experience. However, it also comes with its own set of risks and downsides.

In this article, we’ll explore the pros and cons of spot stock trading and help you decide if it’s the right choice for your investment strategy.

From the potential for high returns to the risks of market volatility, we’ll cover all the key factors to consider before diving into this exciting but challenging world. So, whether you’re a seasoned trader or a newcomer to the stock market, keep reading to find out if spot stocks trading is the right choice for you.

Spot stock trading is a type of trading where investors buy and sell stocks on the spot, with the intention of profiting from short-term price fluctuations. In contrast to long-term investments where investors hold onto stocks for a period of months or even years, spot stock strading involves buying and selling stocks within a matter of days, hours, or even minutes.

This type of trading allows investors to take advantage of short-term market fluctuations and earn quick profits. Spot stock trading is also known as day trading or intraday trading.

One of the biggest advantages of spot stock trading is the potential for high returns. Because spot stock trading involves buying and selling stocks quickly, investors have the potential to earn significant profits in a short amount of time.

Spot stock trading also allows investors to capitalize on market volatility. When the market is rapidly changing, investors can quickly buy and sell stocks to take advantage of price fluctuations.

Another advantage of spot stocks trading is the fast-paced trading experience. Unlike long-term investments where investors must wait for months or even years to see a return on their investment, spot stock trading offers a more immediate gratification.

This can be particularly appealing to investors who enjoy the thrill of trading and want to see results quickly.

Spot stocks trading also offers investors a high degree of control over their investments. Investors can decide which stocks to buy and sell, how much to invest, and when to enter and exit the market.

This level of control allows investors to react quickly to market changes and make decisions based on their own research and analysis.

While spot stock trading offers the potential for high returns, it also comes with its own set of risks and downsides. One of the biggest risks of spot stocks trading is market volatility.

Because spot stock trading involves buying and selling stocks quickly, investors are more susceptible to market fluctuations. If the market changes rapidly, investors may not have enough time to react and may suffer losses as a result.

Another downside of spot stocks trading is the high level of competition. Because spot stock trading is popular among investors, competition for the best stocks can be intense. This can make it difficult for new investors to enter the market and find profitable trades.

Spot stock trading also requires a significant amount of time and effort. Unlike long-term investments where investors can take a more hands-off approach, spot stocks trading requires constant monitoring of the market and quick decision-making. This can be stressful and time-consuming for investors who have other commitments.


Spot stocks trading is just one of many types of trading available to investors. Other popular forms of trading include swing trading, position trading, and trend trading.

Each of these trading styles has its own advantages and disadvantages, and investors should choose the one that best suits their investment goals and risk tolerance.

Swing trading, for example, involves holding onto stocks for a period of days or weeks with the intention of profiting from short-term price fluctuations.

This type of trading is less fast-paced than spot stocks trading and may be more suitable for investors who want to take a slightly longer-term approach.

Position trading, on the other hand, involves holding onto stocks for a period of months or even years. This type of trading is less focused on short-term price fluctuations and more focused on the long-term growth potential of a company.

Trend trading involves buying and selling stocks based on the direction of the overall market trend. This type of trading is less focused on individual stocks and more focused on the overall market.

Because spot stocks trading involves a high degree of risk, it’s important for investors to have a solid risk management strategy in place. One of the most important aspects of risk management is setting stop-loss orders. A stop-loss order is an order to sell a stock when it reaches a certain price point. This can help investors limit their losses in the event of a market downturn.

Another key aspect of risk management is diversification. Investors should not put all their money into one stock or sector. Instead, they should spread their investments across multiple stocks and sectors to minimize risk.

It’s also important for investors to have a clear exit strategy in place. This means knowing when to sell a stock and take profits or cut losses. Having a clear exit strategy can help investors avoid emotional decision-making and make rational decisions based on market data.

There are many different strategies that investors can use when spot stocks trading. Some popular strategies include:

– Scalping: This involves buying and selling a stock quickly to profit from small price movements.

– Momentum trading: This involves buying stocks that are trending upwards and selling stocks that are trending downwards.

– Contrarian trading: This involves buying stocks that are trending downwards and selling stocks that are trending upwards.

– Range trading: This involves buying stocks at the bottom of a price range and selling them at the top of the range.

Each of these strategies has its own advantages and disadvantages, and investors should choose the one that works best for their investment goals and risk tolerance.

If you’re interested in spot stocks trading, there are a few steps you can take to get started:

1. Learn the basics: Before you start trading, it’s important to understand the basics of the stock market, including how stocks are traded, how to read stock charts, and how to analyze market data.

2. Choose a trading platform: There are many online trading platforms that allow investors to buy and sell stocks. Choose a platform that is reputable, easy to use, and has low fees.

3. Practice with a demo account: Many trading platforms offer demo accounts that allow investors to practice trading with virtual money. This can be a good way to get a feel for how spot stocks trading works without risking real money.

4. Develop a trading strategy: Choose a trading strategy that works for you and stick to it. This can help you make rational decisions based on market data rather than emotions.

5. Start small: When you’re first starting out, it’s important to start with small investments and gradually increase your investment as you gain experience.

Choosing the right spot stocks trading platform is crucial for success in the stock market. When choosing a platform, consider the following factors:

– Reputation: Choose a platform that is reputable and has a good track record.

– Fees and commissions: Look for a platform that has low fees and commissions.

– User interface: Choose a platform that is easy to use and has a user-friendly interface.

– Trading tools: Look for a platform that offers tools for analyzing market data and making informed trading decisions.

– Customer support: Choose a platform that offers good customer support and is responsive to your needs.

When spot stock trading, investors must pay fees and commissions to their trading platform. These fees can vary depending on the platform and the type of trade being made. Some common fees and commissions include:

– Trading fees: This is the fee charged by the trading platform for each trade made.

– Account maintenance fees: Some platforms charge a fee for maintaining an account.

– Inactivity fees: Some platforms charge a fee if an account is inactive for a certain period of time.

– Withdrawal fees: Some platforms charge a fee for withdrawing funds from an account.

It’s important to understand the fees and commissions associated with spot stocks trading before getting started. Investors should choose a platform with low fees and commissions to maximize profits.

Spot stock trading offers the potential for high returns and a fast-paced trading experience. However, it also comes with its own set of risks and downsides.

Before diving into the world of spot stock trading, it’s important to understand the pros and cons and develop a solid risk management strategy. By doing so, investors can take advantage of the potential profits of spot stock trading while minimizing their risk.


Strategies for Trading in a Bull Market

Trading in a bull market can be exciting for investors, as market trends are generally positive and offer potential for profit. However, it is important to have effective trading strategies in place to navigate the challenges and make informed decisions. In this article, we will explore the basics of trading and delve into essential strategies for maximizing profits in a bull market.

Key Takeaways:

  • Having effective trading strategies is crucial in a bull market.
  • Understanding the fundamentals of trading is essential.
  • Developing a trading plan and managing risk are key components of successful trading.
  • Technical and fundamental analysis can be utilized to identify trading opportunities.

Understanding the basics of trading

Trading is a popular way of investing money and making quick profits. There are several types of trading, including forex trading, stock trading, options trading, day trading, and online trading. Each type of trading is approached differently, and it is essential to understand the basics to make the right trading decisions in a bull market.

Forex trading

Forex trading involves buying and selling of currencies in the foreign exchange market. Traders speculate on the rise and fall of currency values and make profits by predicting market fluctuations.

Stock trading

Stock trading involves buying and selling shares of public companies in the stock market. Traders aim to buy shares when prices are low and sell them when prices are high, thus making a profit.

Options trading

Options trading involves buying and selling of options contracts, which give traders the right to buy or sell a stock at a fixed price before a specified expiration date. It is a flexible and versatile way of trading that requires a good understanding of market trends.

Day trading

Day trading involves buying and selling securities within a single trading day. Traders target volatile stocks like penny stocks and use technical analysis to make quick profits.

Online trading

Online trading allows traders to buy and sell securities through an online trading platform. It is a convenient and cost-effective way of trading that requires a good understanding of the trading platform.

Understanding the fundamentals of each type of trading is crucial in making informed trading decisions. It is essential to have a trading strategy specific to each type of trading and adjust it to suit the market conditions in a bull market.

Developing a trading plan

Trading in a bull market can be profitable, but it’s important to have a well-defined trading plan in place. Here are the key components to consider:

ComponentDescription
Realistic goalsSet achievable goals based on your risk tolerance and trading style. Strive for consistent, steady profits rather than quick gains.
Risk toleranceDetermine how much risk you are willing to take on each trade, and adjust your position sizes and stop-loss orders accordingly.
Entry and exit strategiesDefine specific criteria for entering and exiting trades, based on technical and/or fundamental analysis. Stick to your plan and avoid emotional decision-making.

By establishing a trading plan, you can reduce the likelihood of making impulsive or reactive trades, and ensure that you are consistently following a profitable strategy.


Technical analysis for bull market trading

Technical analysis is a popular approach to trading in a bull market. It involves studying past market data, particularly price and volume, to identify patterns and trends. These patterns can then be used to make informed trading decisions.

Traders who use technical analysis often use various tools and indicators to help them identify potential opportunities. Some common technical analysis tools include moving averages, trend lines, and candlestick charts. These tools can help traders analyze price movements and identify potential support and resistance levels.

One popular technical analysis strategy is called “buying the dip.” This involves buying a stock or other asset when its price drops, with the expectation that it will eventually rebound. Traders who use this strategy often look for oversold conditions using indicators such as the Relative Strength Index (RSI) or Stochastic Oscillator.

Algorithmic trading in a bull market

Another trend in bull market trading is the use of algorithmic trading or “algo trading.” This involves using computer programs to execute trades automatically based on pre-defined rules and parameters.

Algo trading can be particularly useful in a bull market, where opportunities can arise quickly and unexpectedly. It allows traders to react quickly to market conditions and take advantage of potential opportunities.

Advantages of algorithmic trading in a bull market:Disadvantages of algorithmic trading in a bull market:
Fast reaction to market conditionsNo emotional biasAbility to backtest strategiesRequires significant technical knowledgeRisk of technical glitches or errorsNo room for discretionary decision making

Overall, technical analysis and algorithmic trading can be effective strategies for traders in a bull market. However, it’s important for traders to carefully consider their risk tolerance and goals before implementing these strategies.

Fundamental Analysis for Bull Market Trading

Fundamental analysis is a key tool in the arsenal of successful traders, particularly in a bull market. To identify undervalued stocks, traders need to analyze company financials, industry trends, and market news.

There are several key metrics that traders should consider when conducting fundamental analysis. These include earnings per share, price-to-earnings ratio, price-to-book ratio, and dividend yield. By analyzing these metrics, traders can gain insights into the financial health of a company and determine whether its stock is undervalued or overvalued.

In addition to financial metrics, traders should also consider broader market trends and news. For example, if there is positive news about an industry or sector, such as a new innovation or product launch, it may be a good time to invest in stocks related to that industry or sector. Similarly, if there is negative news about a company or industry, such as a major scandal or regulatory change, it may be a good time to avoid investing in those stocks.

It’s important to note that while fundamental analysis is a powerful tool, it should not be the only tool used in trading. Other factors, such as technical analysis and risk management, should also be considered when making trading decisions.

Example of Fundamental Analysis in a Bull Market

CompanyEPSP/E ratioP/B ratioDividend Yield
XYZ Corporation3.5020.52.22.5%
ABC Corporation4.2018.01.73.0%

Based on the fundamentals, it appears that ABC Corporation is undervalued compared to XYZ Corporation. With a higher EPS, lower P/E and P/B ratios, and a higher dividend yield, ABC Corporation presents a better investment opportunity.

Managing Risk in a Bull Market

While a bull market can offer numerous trading opportunities, it also comes with inherent risks that traders need to be aware of. Here are some risk management techniques that traders can employ:

Diversification

Diversification is a technique that allows traders to spread their investments across different asset classes, such as stocks, bonds, and commodities. By diversifying their portfolio, traders can reduce their overall risk exposure and minimize the impact of market volatility.

Position Sizing

Position sizing is the process of determining the appropriate amount of capital to allocate to each trade. By calculating the ideal position size, traders can ensure that they are not risking too much capital on a single trade, thereby reducing their potential losses in case of unfavorable market conditions.

Stop-Loss Orders

Stop-loss orders are a risk management tool that allows traders to automatically sell a security if it drops below a certain price level. By setting stop-loss orders, traders can limit their potential losses and prevent their trades from turning into disasters.

Hedging Strategies

Hedging is a technique that involves taking an offsetting position in another security or market to reduce the overall risk exposure of a portfolio. For example, a trader who is long on oil futures may hedge their position by shorting the US dollar, as oil prices tend to rise when the dollar weakens.

Asset ClassRisk Management Technique
Futures TradingStop Loss Orders, Hedging Strategies
Commodities TradingDiversification, Position Sizing

By implementing these risk management techniques, traders can protect their capital and effectively navigate the challenges of a bull market.

Conclusion

Trading in a bull market can be both exciting and challenging. By implementing effective trading strategies, traders can take advantage of the potential opportunities while minimizing risks.

Plan, Analyze, and Manage

A well-defined trading plan is essential in a bull market. Setting realistic goals and determining risk tolerance can help traders make informed decisions. Technical and fundamental analysis techniques can be used to identify potential trading opportunities and undervalued stocks. Proper risk management techniques, such as diversification and stop-loss orders, can also help traders manage their positions effectively.

Continuous Learning

It’s important to note that trading is a continuous learning process. Traders should always be open to learning new strategies and techniques to stay ahead of the game. Keeping up with the latest market news and trends can also help traders make informed decisions.

In Conclusion

By following the strategies and techniques outlined in this article, traders can navigate a bull market with confidence and maximize their profits. Remember to plan, analyze, and manage your trades effectively and continuously build upon your knowledge and skills.


Why Mubasher Capital is the Best Stocks Exchange in Bahrain

1. Hey there, stock market enthusiasts!

If you’re looking to invest in stocks in Bahrain, then Mubasher Capital is the place to be! This ultimate guide will give you all the information you need on why Mubasher Capital rocks and why it’s the best stocks exchange in Bahrain. From our wide range of investment options to our top-notch customer service, Mubasher Capital has it all. So buckle up and get ready to dive into the world of stocks with Mubasher Capital!

https://unsplash.com/@charlad

https://unsplash.com/@charlad

2. What’s the deal with Mubasher Capital? It’s awesome, that’s what!

Mubasher Capital has become the go-to destination for stock market enthusiasts in Bahrain & Middle East, and for good reason. When it comes to investing in stocks, Mubasher Capital is unmatched in terms of its offerings and services.

One of the key reasons that sets Mubasher Capital apart from the competition is its wide range of investment options. Whether you’re a beginner looking to dip your toes into the stock market or an experienced investor seeking to diversify your portfolio, Mubasher Capital has got you covered. From local stocks to international shares, they provide a comprehensive selection that caters to all investment preferences.

But it doesn’t stop there. Mubasher Capital also excels in providing top-notch customer service. Our team of knowledgeable and dedicated professionals is always ready to assist you with any queries or concerns you may have. They understand that investing in stocks can sometimes be intimidating, especially for beginners, and they are committed to making the process as seamless and enjoyable as possible.

So if you’re ready to embark on your stock market journey, there’s no better time to join the Mubasher Capital family. Stay tuned for more in-depth insights into why Mubasher Capital truly rocks as the ultimate stocks exchange in Bahrain!

https://unsplash.com/@sonnysaguil

https://unsplash.com/@sonnysaguil

3. So, why should you choose Mubasher Capital for all your stock market needs?

Let’s dive deeper into the reasons why Mubasher Capital stands out as the ultimate stocks exchange in Bahrain.

One of the main advantages of choosing Mubasher Capital is Our cutting-edge technology. They have invested heavily in advanced trading platforms that provide investors with real-time data, comprehensive market analysis, and seamless execution of trades. This means that you can stay informed and make informed decisions about your investments at any time and from anywhere.

In addition to Our technology, Mubasher Capital also offers a wide range of research tools and educational resources to help you enhance your investment knowledge and make confident decisions. From daily market reports to insightful research articles, they provide valuable insights that you can use to stay ahead of the game.

Furthermore, Mubasher Capital prioritizes transparency and integrity in all Our operations. They adhere to strict regulatory standards to ensure that your investments are safe and secure. With Our strong track record and reputation, you can trust Mubasher Capital to prioritize your financial well-being.

So, whether you’re a seasoned investor or just starting out, Mubasher Capital has everything you need to make the most of the stock market. Stay tuned for more tips and insights on how to maximize your investment potential with Mubasher Capital!

https://unsplash.com/@charlad

https://unsplash.com/@charlad


4. Let’s dive into all the reasons why Mubasher Capital rocks!

Mubasher Capital is not your average stock exchange; it’s a game-changer in the financial industry. Here are some more reasons why you should consider Mubasher Capital for all your stock market needs:

Firstly, Our customer service is second to none. Unlike other exchanges that treat you like just another number, Mubasher Capital believes in building meaningful relationships with our clients. They have a dedicated team of knowledgeable professionals who are always ready to assist you with any questions or concerns you may have.

Secondly, Mubasher Capital offers a wide range of investment products and services. Whether you are interested in individual stocks, mutual funds, Asset Management, or even IPOs, they have got you covered. They understand that every investor is unique, and they tailor Our offerings to meet your specific needs and goals.

Lastly, Mubasher Capital has a solid reputation in the industry. They have been serving investors in Bahrain & MENA Region for years and have earned Our trust and respect. Our commitment to excellence and dedication to delivering exceptional results make them the go-to choice for many investors.

In the next section, we will explore some success stories of investors who have achieved great results with Mubasher Capital. Stay tuned!

Mubasher Capital Bahrain

https://unsplash.com/@todd_g

5. The best stocks exchange in Bahrain? Look no further than Mubasher Capital!

If you’re looking for the best stocks exchange in Bahrain, Mubasher Capital is the answer. They offer a wide range of investment opportunities, superior customer service, and a solid reputation in the industry. But don’t just take our word for it, let’s take a look at some success stories from investors who have achieved great results with Mubasher Capital.

One investor, Sarah, had always wanted to invest in the stock market but didn’t know where to start. She decided to give Mubasher Capital a try and was pleasantly surprised. Our knowledgeable team guided her through the process, answering all her questions and helping her build a diversified portfolio. Within a year, Sarah’s investments had grown significantly, thanks to the expert advice and support she received from Mubasher Capital.

Another investor, Ahmed, had been investing in the stock market for years but wasn’t seeing the results he wanted. He decided to switch to Mubasher Capital, and it was a game-changer. The comprehensive range of investment products and services allowed Alot of Investors to diversify their portfolios and take advantage of new opportunities. With the guidance of Mubasher Capital, Investors’s investments started yielding higher returns, surpassing his expectations.

These success stories are just a glimpse of what Mubasher Capital can offer. If you’re ready to take your investing journey to the next level, it’s time to give Mubasher Capital a try. Stay tuned for the next section, where we’ll explore some of the most popular investment options available on Mubasher Capital’s platform.

6. Wrap up: Mubasher Capital – the ultimate stock market destination in Bahrain!

In conclusion, Mubasher Capital continues to prove why it is the best stocks exchange in Bahrain. With its wide range of investment opportunities, superior customer service, and a solid reputation, it has become the go-to platform for investors looking to achieve their financial goals.

Through the success stories of investors , we have seen how Mubasher Capital’s knowledgeable team, expert advice, and comprehensive range of investment products and services have made a significant impact on their portfolios. Whether you’re a beginner or an experienced investor, Mubasher Capital can help you build a diversified portfolio and maximize your returns.

So, if you’re ready to take your investing journey to the next level, I highly recommend giving Mubasher Capital a try. Stay tuned for the next section, where we’ll explore some of the most popular investment options available on Mubasher Capital’s platform. Get ready to discover a world of possibilities and rock the stock market with Mubasher Capital!

Mubasher Capital

https://unsplash.com/@ajmal_shams

7. Conclusion

In conclusion, Mubasher Capital is undeniably the top choice for anyone looking to invest in the stock market in Bahrain & MENA Region. Its reputation for excellence, vast investment opportunities, and exceptional customer service have solidified its position as the ultimate stock market destination.

As we’ve seen through the success stories of Sarah and Ahmed, Mubasher Capital’s dedicated team and wide range of investment products and services have played a crucial role in their financial success. Whether you’re a beginner or an experienced investor, Mubasher Capital offers the necessary tools and expertise to help you achieve your investment goals.

So, don’t miss out on the chance to take your investing journey to new heights. Give Mubasher Capital a try today and stay tuned for the next section, where we’ll dive into the most popular investment options available on Our platform. Get ready to rock the stock market with Mubasher Capital!


Safe-Haven Assets To Hold During Markets Turmoil​

In times of market volatility, investors need safe-haven investments to provide stability. Gold is still a common option because it is a traditional store of value. Gold ETFs, mining stocks, and actual gold are options available to investors. Furthermore, Treasury Bills (T-Bills) provide reliable, low-risk returns, particularly during periods of high inflation.

There are other commodities that can serve as safe havens. Because consumers always need necessities, defensive stocks are less vulnerable to fluctuations in the economy and continue to be appealing. Even if the World Uncertainty Index has been below 17,000 points for the previous three quarters(see below chart ), geopolitical concerns originating from the Middle East and other parts of the world are contributing to the rise in global uncertainty.

We also still have to deal with the effects of the Russia-Ukraine war on the global economy.​

Safe-Haven Assets Are Not Limited To Gold

A safe-haven asset is an underlying investment that is anticipated to maintain or grow in value (Positive returns) in periods of market volatility brought on by dangers of any kind, whether they be geopolitical, economic, or otherwise. When markets decline, investors look for safe havens to reduce their exposure to losses. Treasury Bills and gold are the two most popular safe-haven assets that yield lucrative returns during crises (particularly those of resilient economies).

Although safe havens can vary depending on the particulars of a market slump, some riskier assets, such  as defensive stocks and commodities, gain positive returns. Major safe havens that encourage portfolio diversification during difficult times are as follows:​

1- Gold.

2- Treasury Bills.

3- Other Commodities.

4- Defensive Stocks.

    World Uncertainty Index (Q4 2019 to Q1 2024)

    safe-have assets

    The Precious Metal Is The Store Of Value:

    Gold, often known as the precious metal, has long been valued as a store of wealth. Gold cannot be created at will, unlike fiat money, and changes in interest rates made by the government have no direct effect on the value of gold. As a type of insurance during bad economic times or protracted market turbulence, investors frequently turn to gold. 

    According to the chart, bullion prices returned positively during US economic downturns, in contrast to the stock market’s (represented by the Dow Jones Industrial Average DJIA) negative returns.​

    1- Gold is often considered a safe-haven asset, especially during times of economic uncertainty.​

    2-Historically, gold has maintained its value over time and tends to perform well when inflation is on the rise.​

    3- Investors can consider physical gold, gold ETFs, or gold mining stocks as part of their portfolio to hedge against inflation.​

    4- Prices (represented by DJIA) touched an all-time high in April 2024, due to recent Middle East tensions (Iran -Israel).​

      Gold Prices Forecasts Seen Going Higher: 

      In April 2024, Deutsche Bank increased their prediction for the price of gold to $2,400 per ounce by year’s end and $2,600 by 2025 end. Bullion is set to reach $3,000 an ounce over the next six to 18 months on increasing investor inflows, driven by wars in the Middle East and Ukraine, buying by central banks and consumer demand in China, according to Citi GroupGoldman Sachs Group says the precious metal is in an “unshakable bull market,” and has raised its year-end forecast to $2,700. UBS Group AG sees $2,500 by the year-end.​

      safe-have assets

      Treasury Bills (T-Bills), Low-Risk offer a Stable Returns amid volatile markets:

      Securities of government debt with maturities ranging from a few days to a year are known as T-Bills. Despite their modest yields, T-Bills are regarded as low-risk investments. Because of their more consistent yields, T-Bills may be preferred by investors during inflationary times, particularly those denominated in the currencies of robust economies.

      The most widely used are the T-Bills, which are fully guaranteed by the US government. Even in turbulent economic times, they are regarded as safe havens and risk-free. Investors often rush to T-bills during times of perceived economic instability.

      The figure on the right-hand chart illustrates that US 1-Year T-Bills provided positive returns at larger rates than inflation during recessions (such as the Dot Com Bubble of 2001–2002 and the Global Financial Crisis of 2009), which used to decline as the recession subsided.​

      Other Commodities, Supply & Demand-Driven Based on Special Issues:

      Beyond gold, other commodities can also act as inflation hedges, other commodities like silver, platinum, palladium, and base metals copper (such as copper), sugar, corn, and livestock are negatively correlated with stocks and bonds.

      These commodities can also serve as safe havens for investors during market volatility. they are influenced by supply and demand dynamics and special issues induce some higher.

      When global economic activity picks up, demand for these commodities tends to rise, potentially leading to price increases.​

      Defensive Stocks-Less Sensitive To Economic Cycles:

      Consumers still buy necessities including foodhealth care productsutilities, and basic household supplies regardless of the situation of the market. Due to their less cyclical performance, companies in these industries are regarded as defensive investments.

      They can therefore serve as safe havens amid downturns in the markets. These stocks give greater stability to any investment portfolio because they are less erratic. Dividend-paying stocks can also be considered defensive, as they offer regular income regardless of market conditions.

      Every crisis or recession is unique, active investing and portfolio diversification are the main solutions to gain positive / real returns or to mitigate risks.​