If you are new to stock trading, you might have heard of the term “moving averages” A moving average is a commonly used technical analysis tool that helps traders identify trends and potential buy/sell opportunities.
In this article, we will explain what moving averages are, how to use them to buy stocks, and advanced techniques to help you take your trading to the next level.
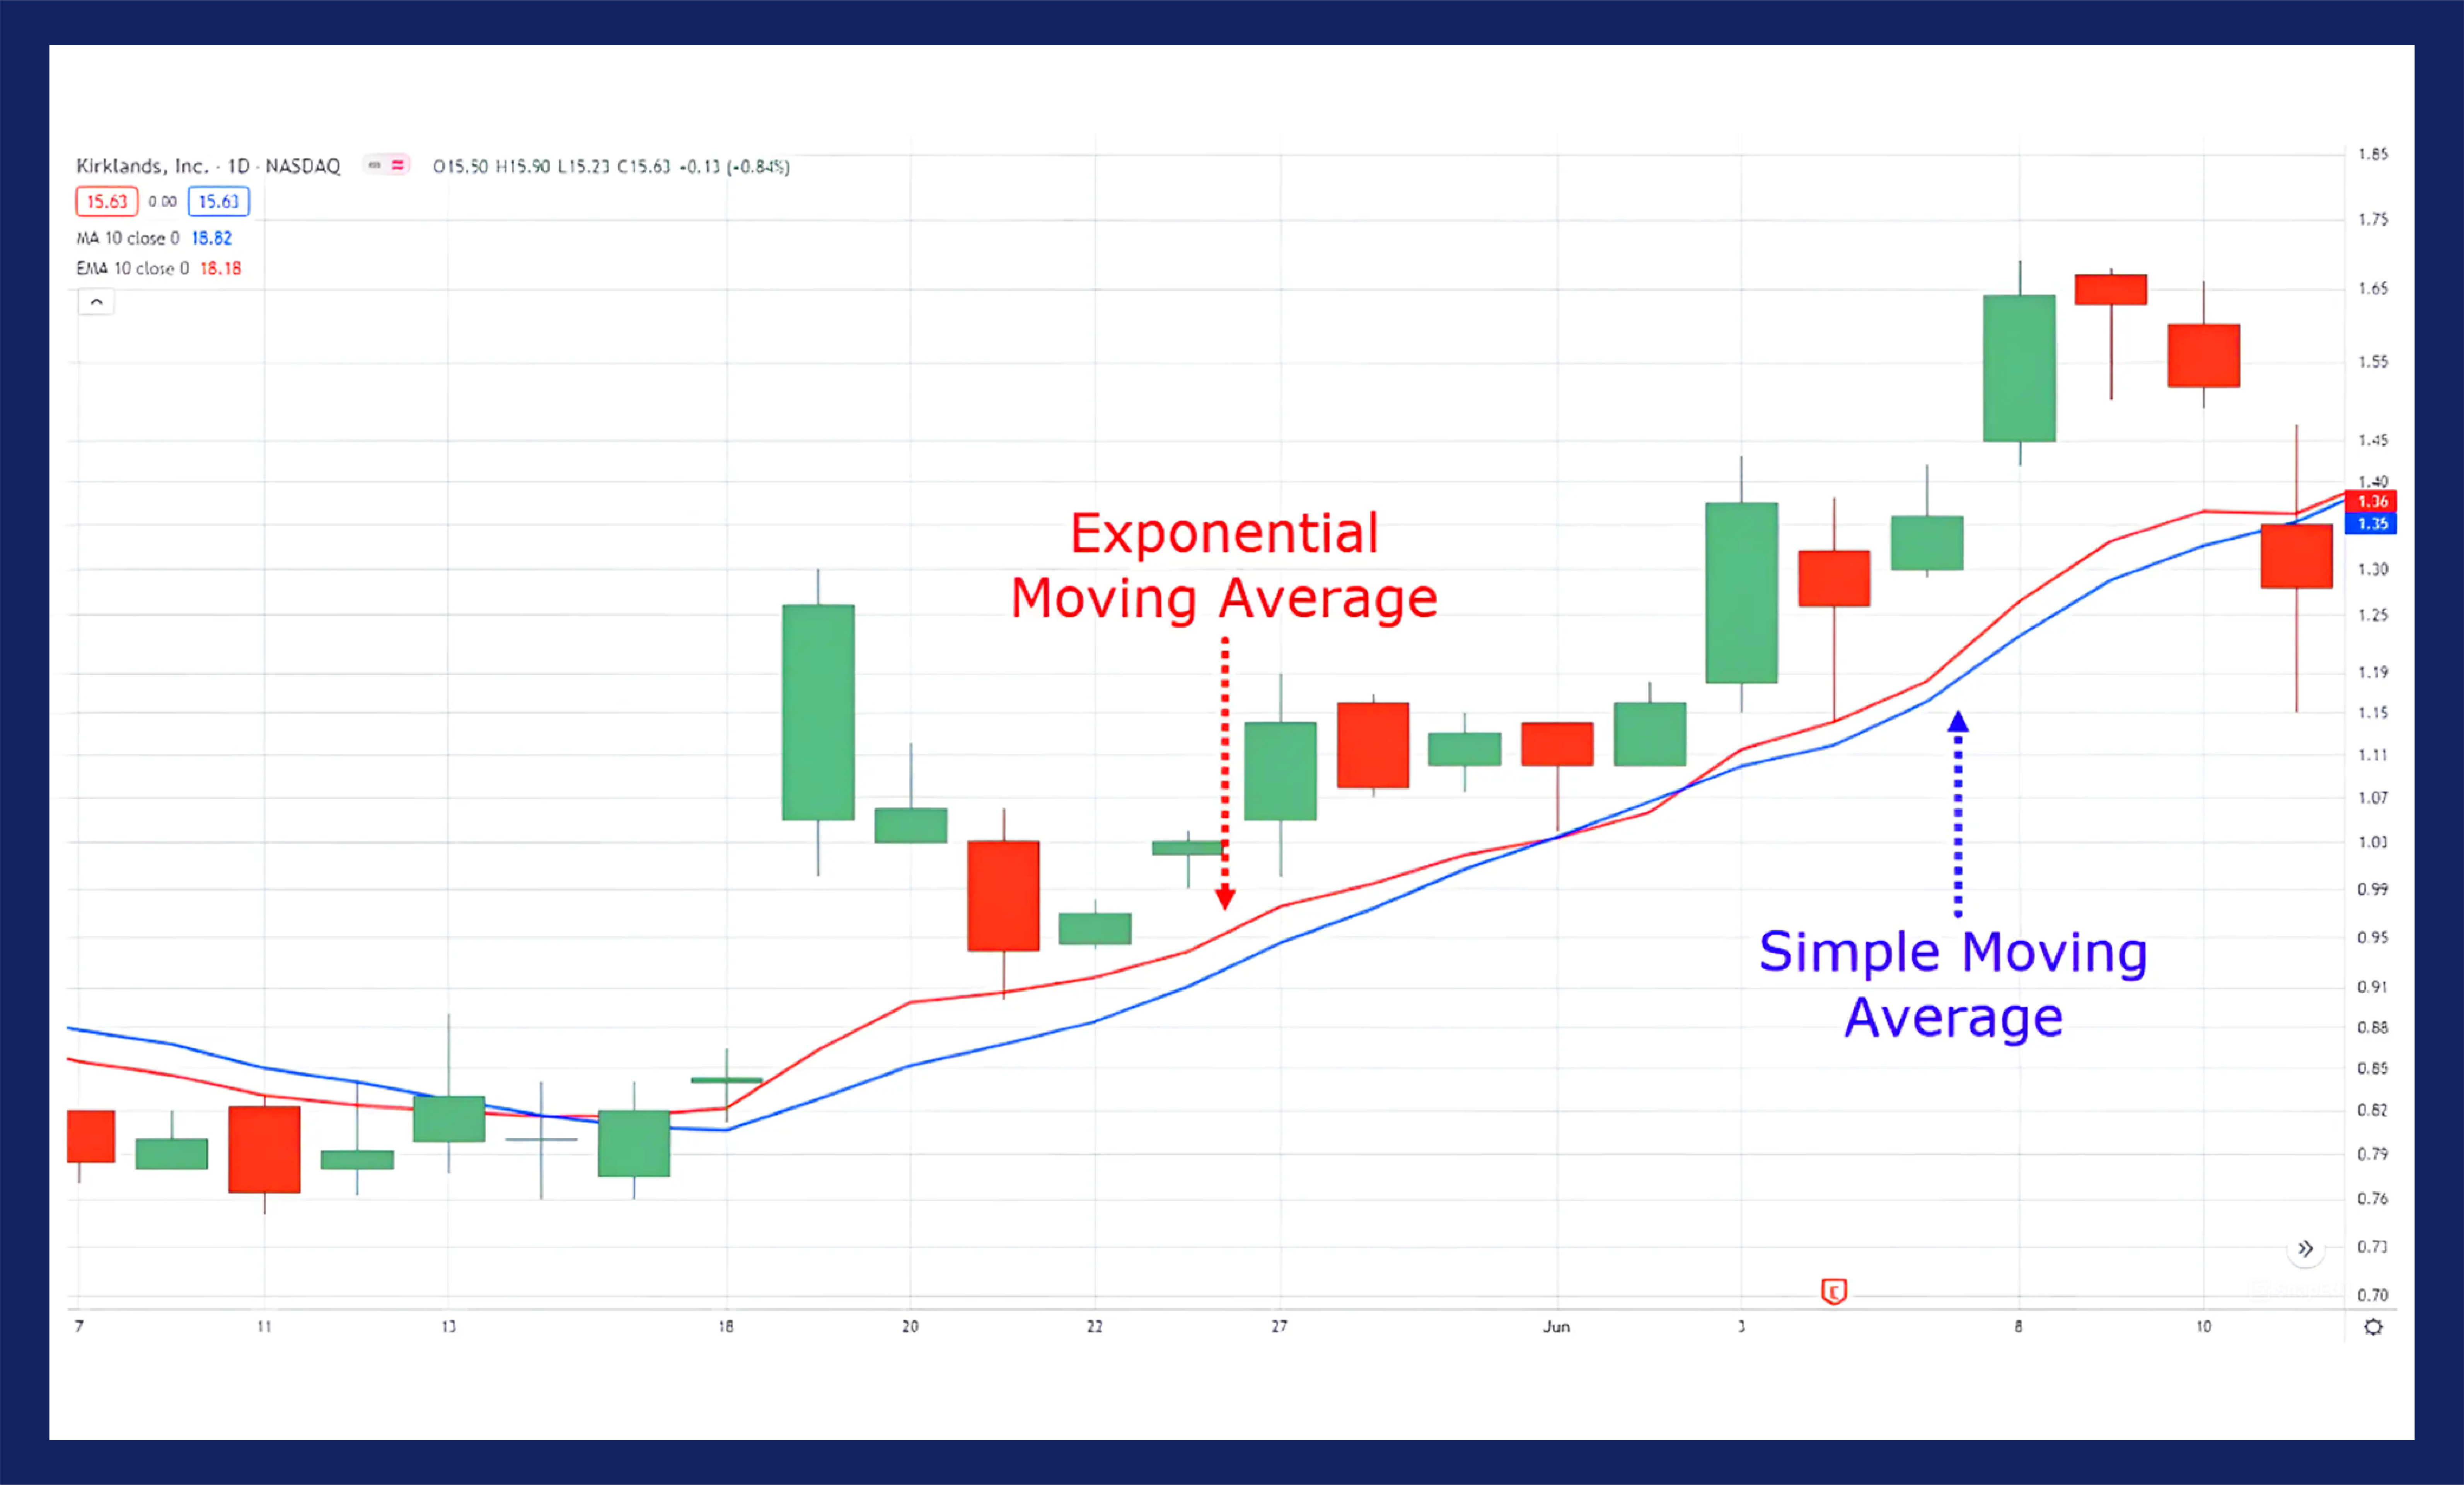
Before we get started, there are two types of moving averages: simple moving averages (SMA) and exponential moving averages (EMA). SMAs give equal weight to each data point, while EMAs give more weight to recent data points. The choice between SMAs and EMAs depends on your trading strategy and style.

Key Takeaways:
- Moving averages are commonly used technical analysis tools for identifying trends and potential buy/sell opportunities.
- There are two types of moving averages: simple moving averages (SMA) and exponential moving averages (EMA).
- The choice between SMAs and EMAs depends on your trading strategy and style.
Understanding Moving Average Crossovers
If you’ve started trading stocks, you probably already stumbled upon the concept of moving averages. A moving average is a trend-following indicator that smooths out fluctuations in stock prices, showing an average price over a certain period of time. However, it’s not enough to simply know what a moving average is, you need to understand what a moving average crossover is and how to use it in your trading strategy.
What is a Moving Average Crossover?
A moving average crossover occurs when two moving averages with different periods intersect. Specifically, a shorter period moving average (e.g. 20-day moving average) will intersect a longer period moving average (e.g. 50-day moving average) at some point. This intersection represents a change in trend direction and can signal a buy or sell signal for traders.
There are two types of moving average crossovers:
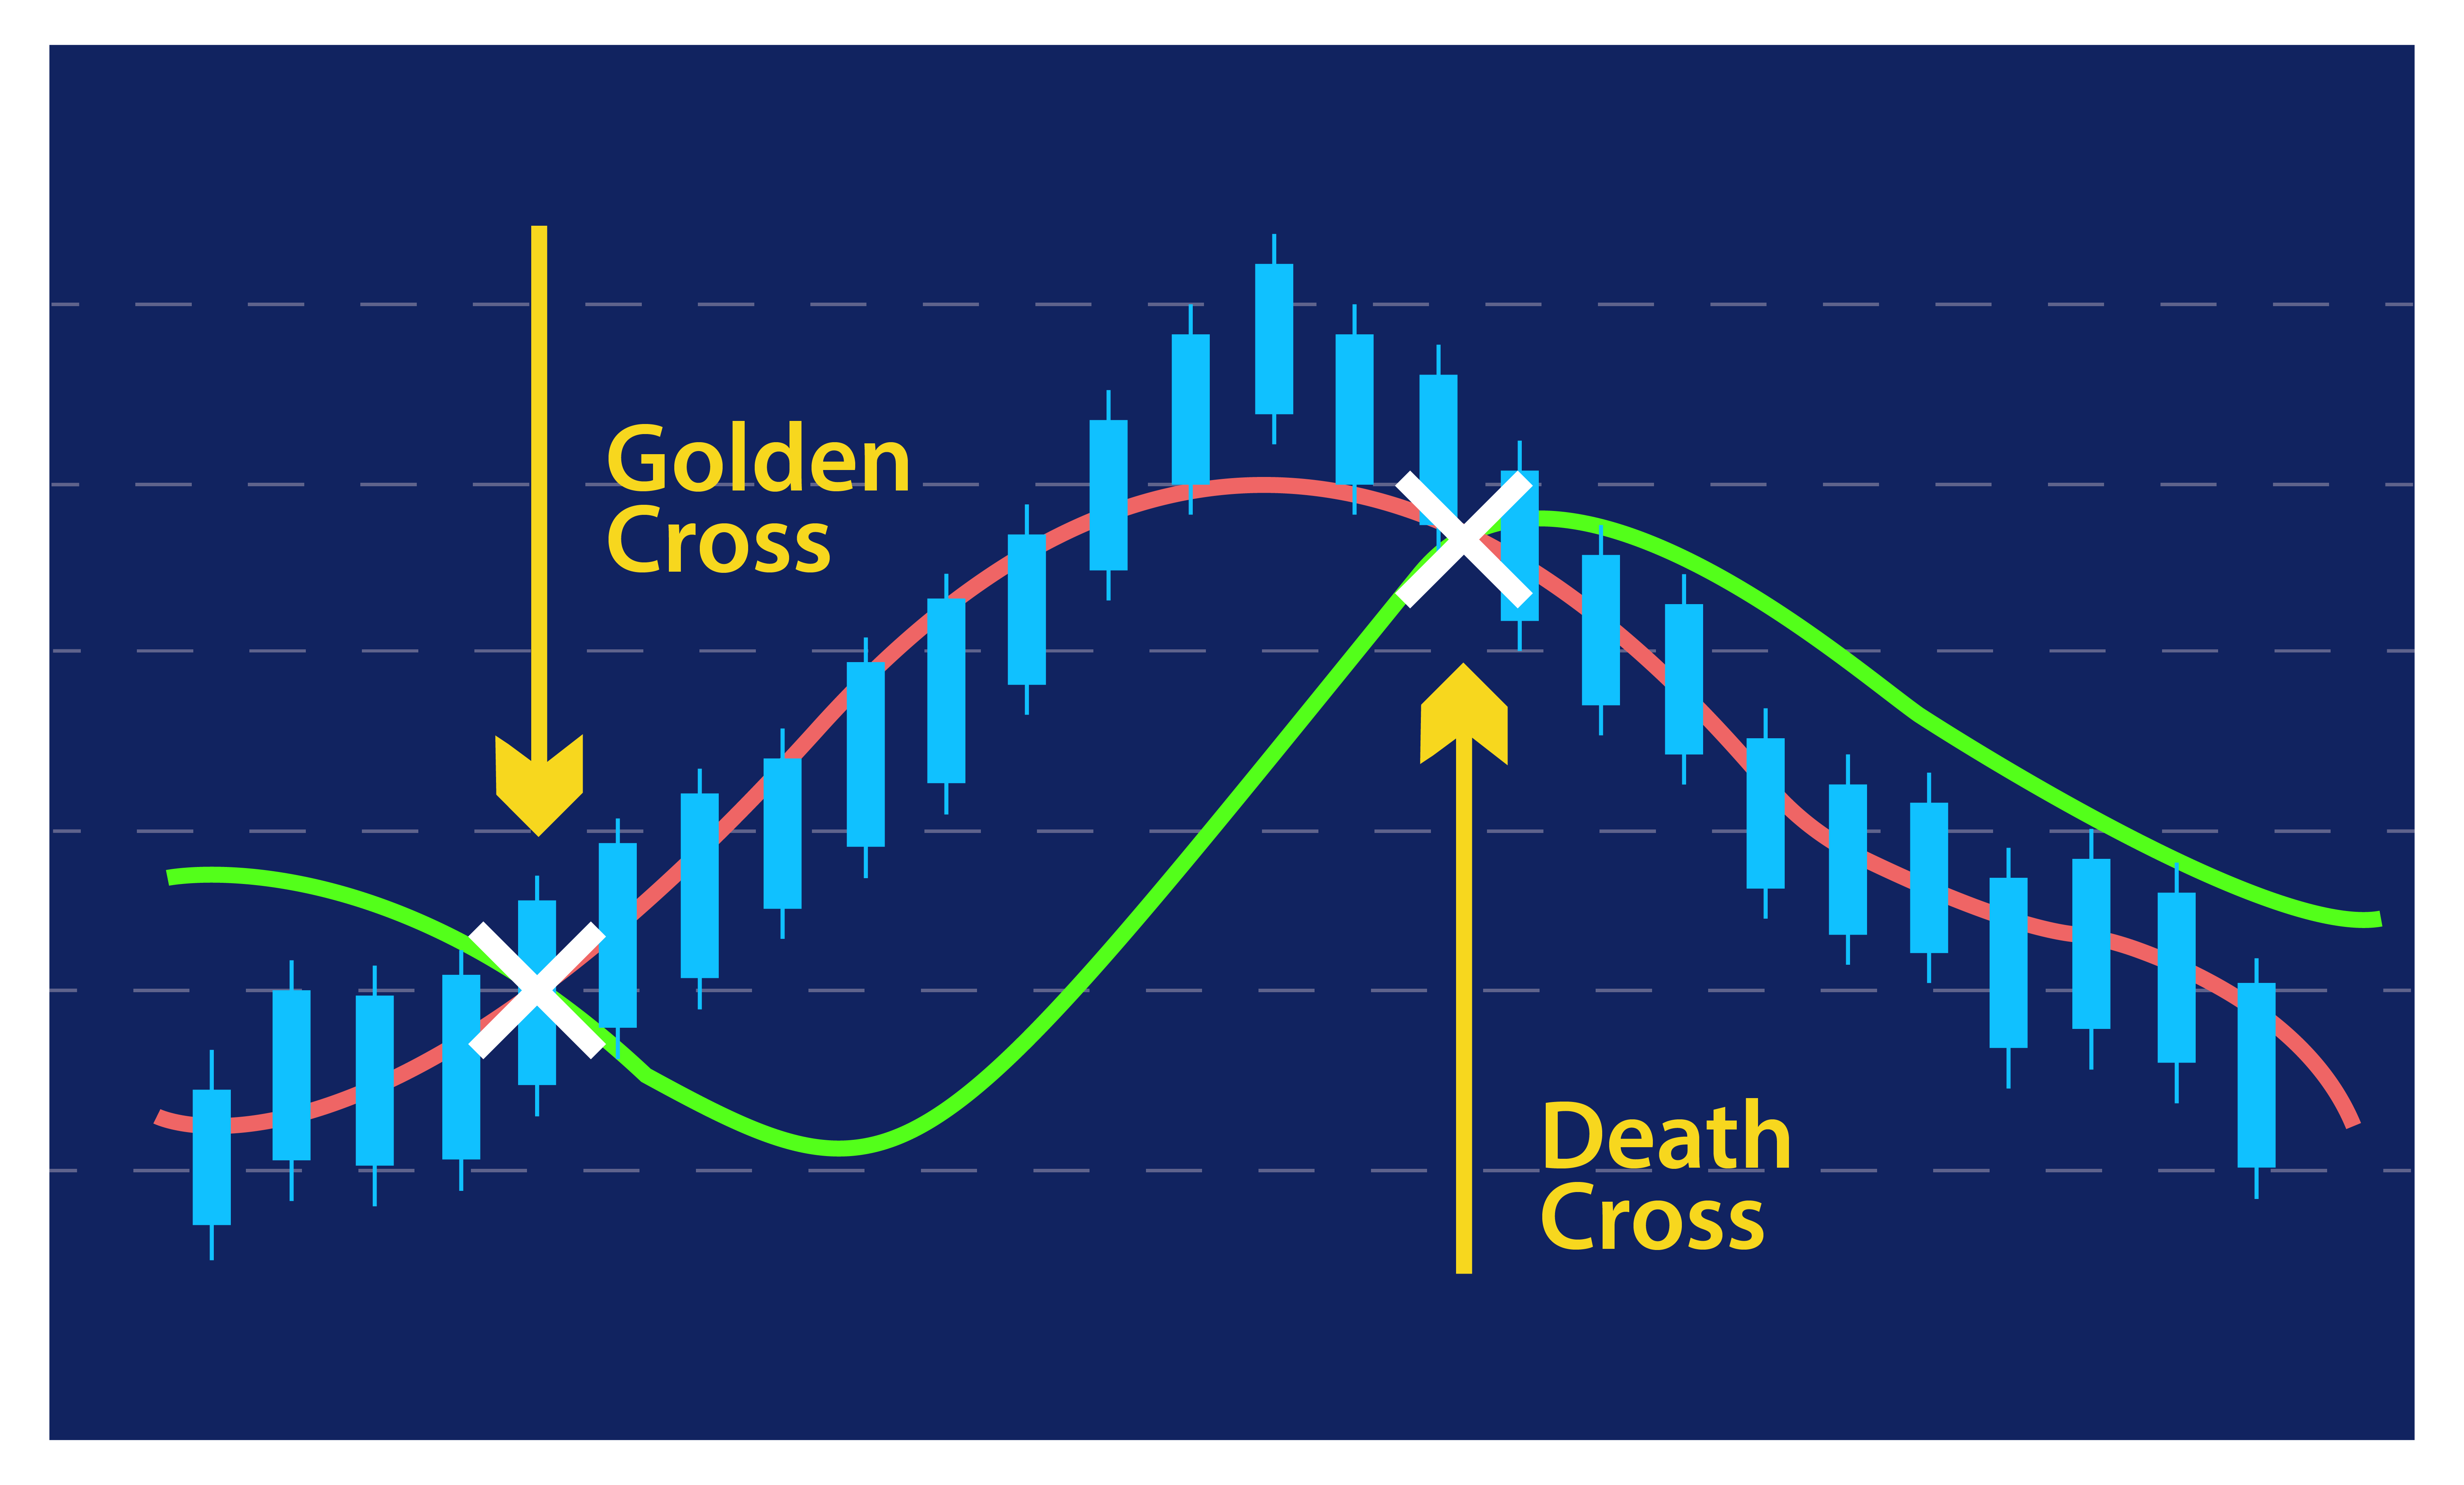
- Golden Cross: This occurs when a shorter period moving average (e.g. 50-day moving average) crosses above a longer period moving average (e.g. 200-day moving average), indicating a bullish trend.
- Death Cross: This occurs when a shorter period moving average (e.g. 50-day moving average) crosses below a longer period moving average (e.g. 200-day moving average), indicating a bearish trend.
The moving average crossover is one of the most popular trading strategies for technical analysts. Its simplicity and clarity make it an effective tool for identifying trends and making trading decisions.

How to Use Moving Average Crossovers in Your Trading Strategy
When using moving average crossovers in your trading strategy, it’s important to consider the following:
- Timeframe: Choose a timeframe that suits your trading style and goals. Short-term traders may use a shorter period moving average (e.g. 20-day moving average) while long-term traders may use a longer period moving average (e.g. 200-day moving average).
- Confirmation: Use other indicators or technical analysis tools to confirm the buy or sell signal from the moving average crossover. Don’t rely solely on the crossover signal.
- Risk management: Set stop-loss orders to limit losses in case the trade goes against you. Also, consider the risk-to-reward ratio before entering a trade.
In conclusion, understanding moving average crossovers is essential for traders who want to use technical analysis to make informed trading decisions.
By combining moving averages with other technical analysis tools, traders can increase their chances of success.
Calculating and Using Moving Averages
Now that you understand the basics of moving averages and how they can be used in conjunction with your stock trading strategy, let’s explore the specifics of how to calculate and use moving averages.
The Moving Average Formula
There are two main types of moving averages: the simple moving average (SMA) and the exponential moving average (EMA).
The SMA calculates the average price of a stock over a specific time period, while the EMA places more weight on recent prices. The formula for calculating the SMA is:
| Period | Closing Prices | SMA |
| Day 1 | 100 | |
| Day 2 | 110 | |
| Day 3 | 120 | |
| Day 4 | 130 | |
| Day 5 | 125 | |
| Day 6 | 135 | |
| Day 7 | 140 | |
| Day 8 | 145 | |
| Day 9 | 150 | |
| Day 10 | 155 |
For example, let’s say you want to calculate the SMA for a stock over a 10-day period. The closing prices for each day are listed in the table above. To calculate the average price for the first day, you would add the closing prices for days 1 through 10 and divide by 10:
(100 + 110 + 120 + 130 + 125 + 135 + 140 + 145 + 150 + 155) / 10 = 130
So the SMA for day 10 would be 130.
Using Moving Averages for Trading
Once you have calculated the SMA or EMA for a stock, you can use it in a number of ways to inform your trading strategy. For example:
- Buy signals: If the price of a stock crosses above its moving average, it may indicate a buy signal. This is known as a golden cross.
- Sell signals: If the price of a stock crosses below its moving average, it may indicate a sell signal. This is known as a death cross.
- Trend identification: You can use moving averages to identify the direction of a stock’s trend. A stock trading above its moving average is considered to be in an uptrend, while a stock trading below its moving average is considered to be in a downtrend.
It’s important to note that no trading strategy is foolproof and that using moving averages alone is not enough to guarantee success in the stock market. It’s always a good idea to do your own research and consult with a financial advisor before making any trading decisions.
Advanced Techniques with Moving Averages
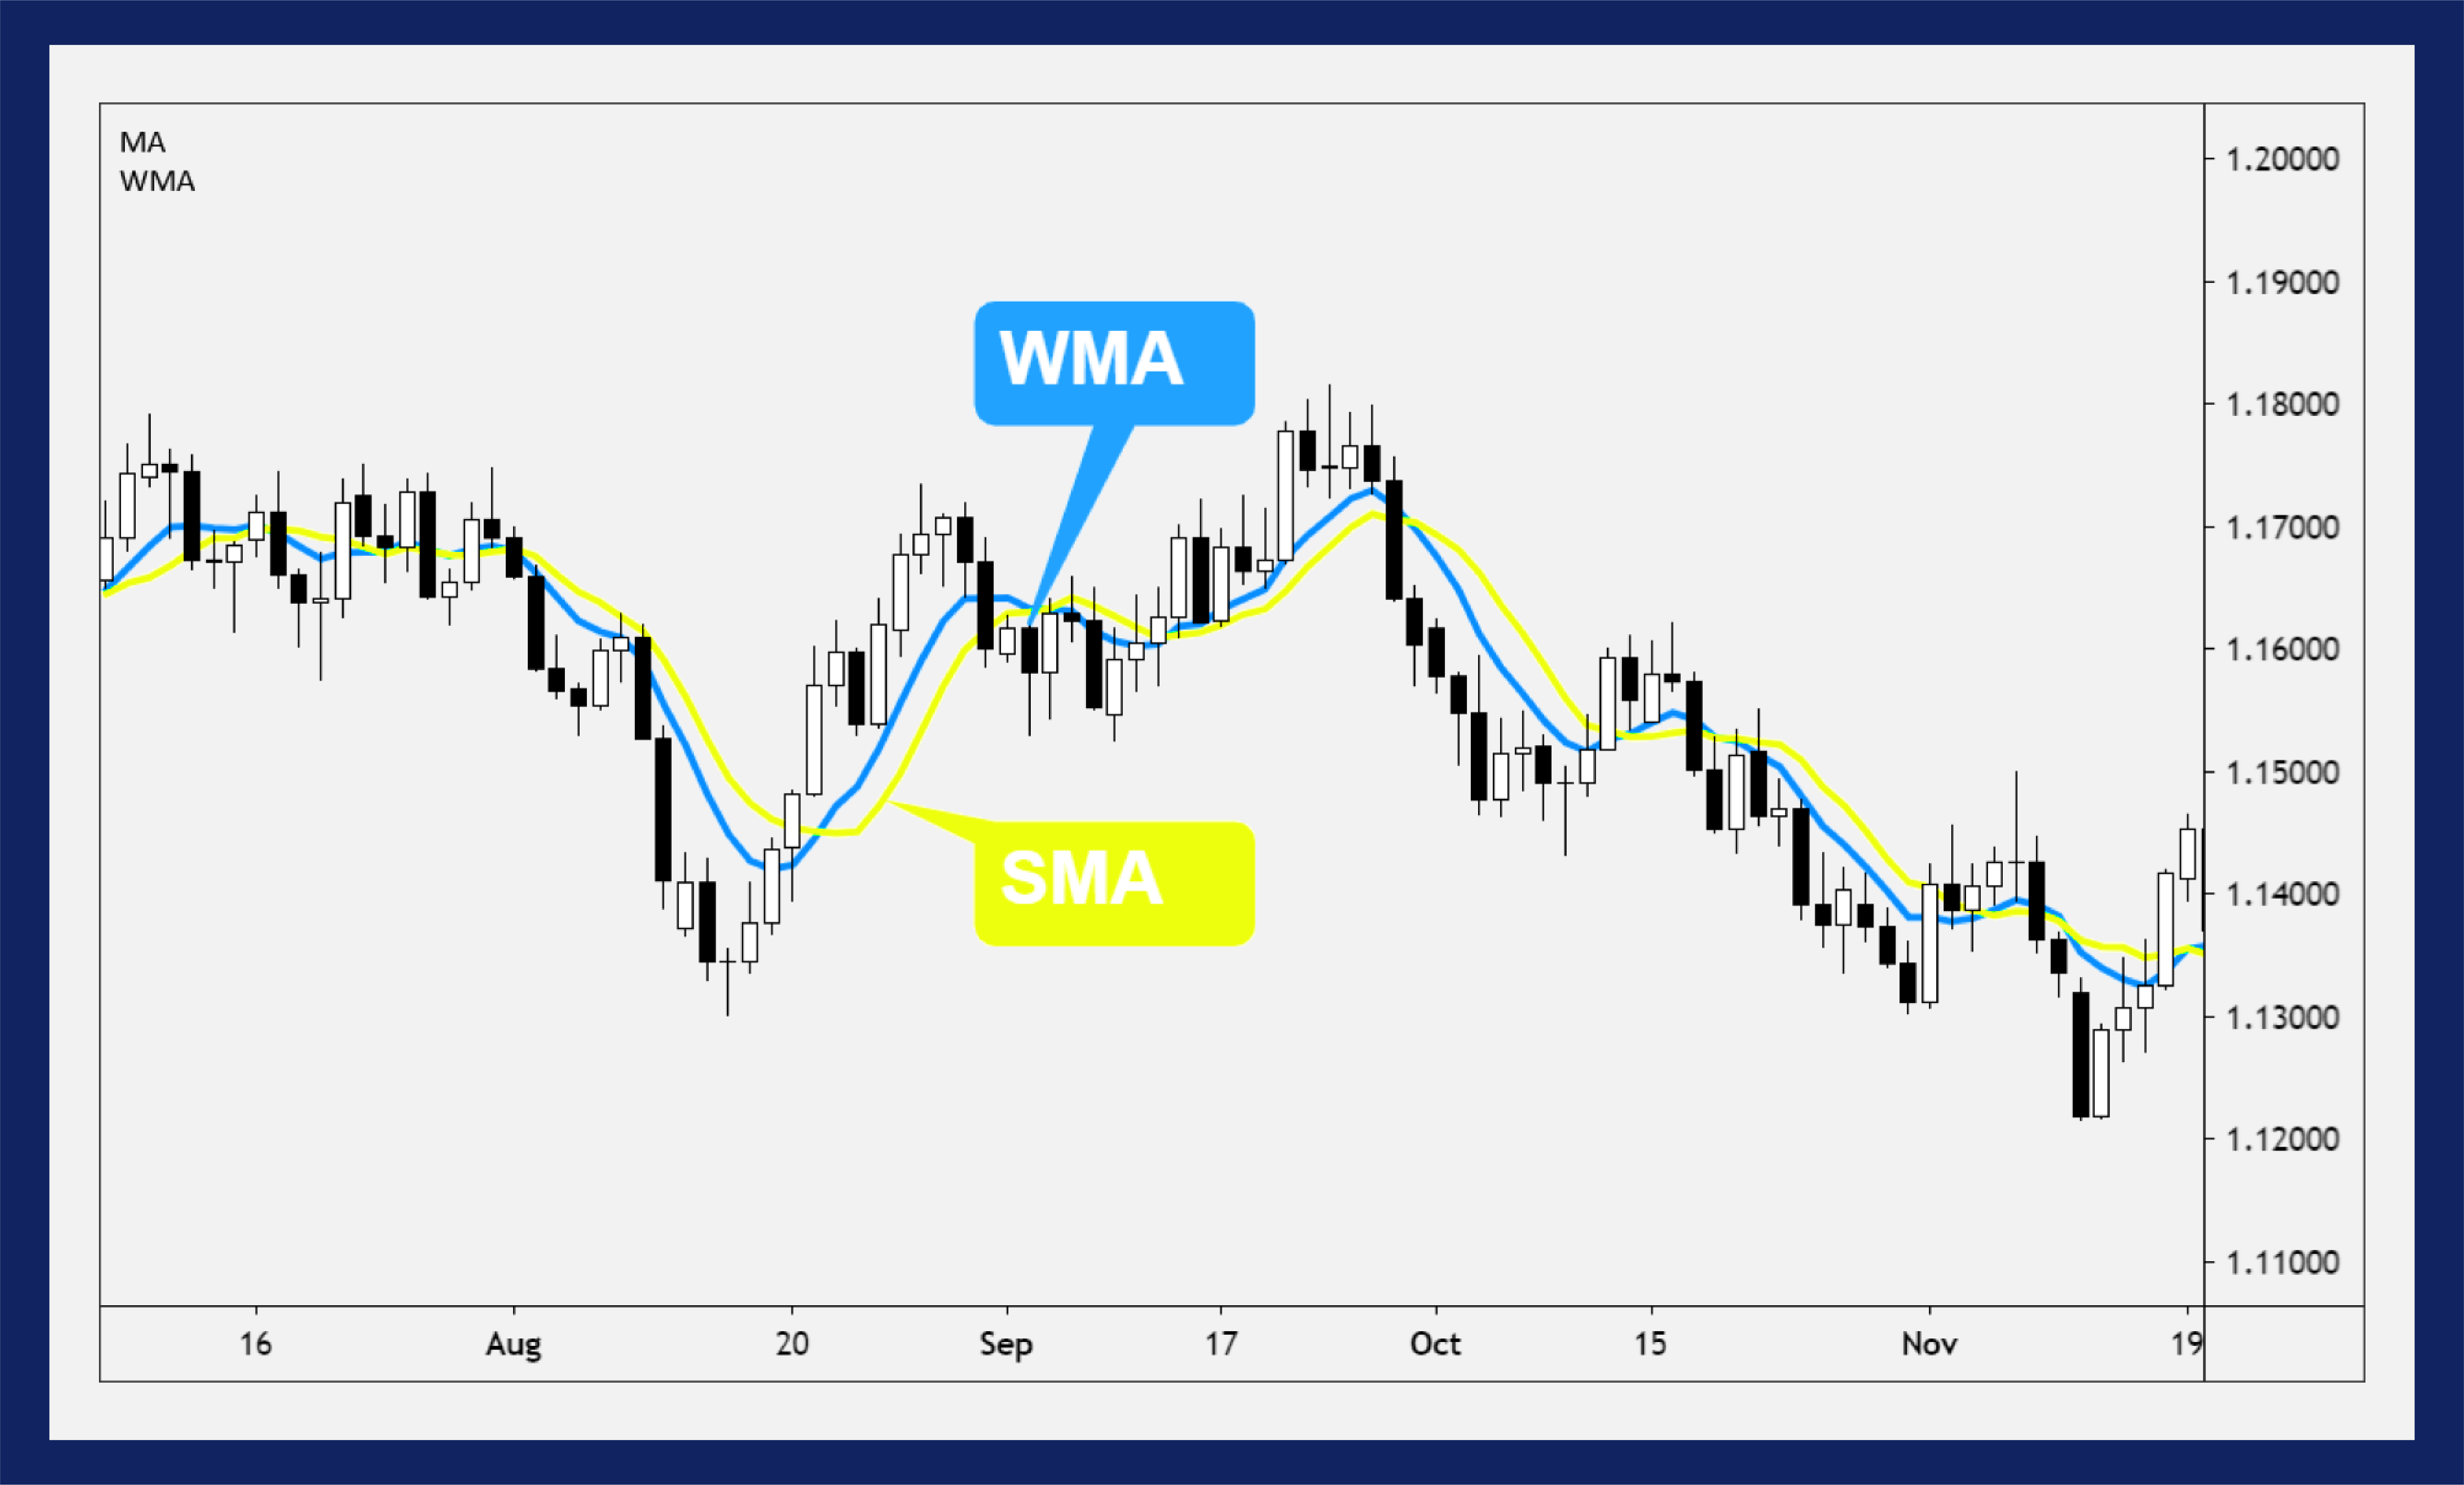
While the simple and exponential moving averages are commonly used by traders, there are other types of moving averages worth exploring. One of these is the weighted moving average (WMA).
The WMA assigns greater weight to the most recent data, making it more responsive to price changes than a simple or exponential moving average. It can be calculated by multiplying each data point by a weight factor that increases linearly with time, and then dividing the sum of these products by the sum of the weight factors.
Another advanced technique with moving averages is the use of multiple moving averages. By combining two or more moving averages with different periods, traders can create a crossover strategy that generates buy and sell signals based on the intersection of the moving averages.

| Period | Moving Average |
| 10 | Simple Moving Average |
| 20 | Exponential Moving Average |
| 50 | Weighted Moving Average |
For example, a trader may use a simple moving average with a period of 10 and an exponential moving average with a period of 20. When the simple moving average crosses above the exponential moving average, it may be a signal to buy, and when it crosses below, it may be a signal to sell.
It is important to note that while moving averages can be powerful tools for analyzing trends and making trading decisions, they should not be used in isolation. Traders should always consider other technical indicators and fundamental factors before making any trades.
Conclusion
In conclusion, moving averages are a powerful tool for stock traders. By taking advantage of the trends in stock prices, traders can make informed decisions about when to buy and sell stocks. Whether using a simple moving average or an exponential moving average, traders can use this tool to their advantage.
Furthermore, by understanding moving average crossovers and using advanced techniques such as weighted moving averages, traders can maximize their profits and minimize their risks.
Remember the Formula
It’s important to keep in mind that the moving average formula is not difficult to calculate. By dividing the sum of the stock prices over a specified number of days by the number of days, you can easily calculate a moving average. And with the right moving average trading strategy, you can capitalize on this knowledge.
So, if you’re looking to start trading stocks, we highly recommend adding moving averages to your trading arsenal. With the right knowledge, you can use this tool to your advantage and make informed decisions about your investments.
FAQ
Q: How do I use a moving average to buy stocks?
A: To use a moving average to buy stocks, you need to first select the type of moving average you want to use, such as a simple moving average or an exponential moving average. Then, determine the time period for the moving average, such as 50 days or 200 days. Once you have set up your moving average, you can use it as a tool to help identify potential buying opportunities in the stock market.
Q: What are moving average crossovers and how do they work?
A: Moving average crossovers occur when two different moving averages intersect. This is often used as a signal to buy or sell stocks.
For example, if a shorter-term moving average crosses above a longer-term moving average, it may indicate a bullish trend and a potential buying opportunity. Conversely, if the shorter-term moving average crosses below the longer-term moving average, it may indicate a bearish trend and a potential selling opportunity.
Q: How do I calculate and use moving averages?
A: Moving averages can be calculated by taking the average of a stock’s closing prices over a specific period of time. This calculation is typically done using a simple formula.
Once the moving average is calculated, it can be used as a trend-following indicator to help identify the direction of the stock’s price movement.
Traders often use moving averages to smooth out short-term fluctuations and identify potential buying or selling opportunities.
Q: Are there any advanced techniques I should know about when using moving averages?
A: Yes, there are advanced techniques that can be used with moving average. One example is the weighted moving average, which places more importance on recent data points. This can be useful for traders who want to give more weight to recent price movements. Additionally, moving averages can be combined with other technical indicators, such as the MACD or RSI, to create more sophisticated trading strategies.
Q: What is the conclusion about using moving average?
A: Using moving averages can be a valuable tool for stock traders. They can help identify trends, smooth out price fluctuations, and provide potential buying or selling signals.
However, it’s important to remember that moving averages should not be used as the sole basis for making trading decisions.
They should be used in conjunction with other forms of analysis and risk management techniques to make informed investment choices.


